In the world of streaming video, real-time metrics are a necessity and can help you catch issues ranging from a little video stuttering to a full blown World-cup style meltdown. (Too soon?)
While our existing Viewer Experience Metrics help users prioritize optimizations that will have the biggest viewer impact, they're less suited for immediately identifying major problems that occur in real time, like outages and regressions. The difference is with one you’re optimizing a video platform over time, while the other you’re huddling in the war room for the big event™ to make sure things just keep running, perfectly.
Because of this, we’re excited to announce our new Real-Time Streaming Dashboard—built from the ground up to help you keep your streams operating smoothly and address any problems as quickly as possible.
What it is
The new Real-Time Streaming Dashboard provides essential metrics for engineering and ops teams in one real-time view. It helps video platform operators immediately spot critical issues or failures and quickly resolve them before they overload your support team or go viral (a.k.a “Treat it before they Tweet it.”)
We’ve intentionally designed the dashboard in “dark mode” knowing the war room environments our customers work in. Too many bright screens can overwhelm instead of inform. Along the same line, our metrics have been designed to provide the key information you need without the clutter. When metrics are at a steady state, you can be confident that viewers are getting the best experience across your platform in that moment.
Everyone defines “real-time” latency differently; in our case, we mean that metrics show up less than 15 seconds after they happen, which is faster than anyone else in the industry. Other QoS platforms claim real-time performance, but metrics are actually delayed by a few minutes or more. When you have an outage, getting data in seconds, and not minutes, is priceless.
Unique metrics, sharper insights
When you’re trying to identify a spike or dip in performance, it’s difficult to know how your current metrics stack up without any context. If you have a playback failure of 4%, is that great or disastrous? It instead raises more questions: what’s your baseline, is 4% an anomaly, when did it start, how long did it last? If all you saw was the 4% number, you’d have to begin the process of investigating. But when you’re monitoring your real-time viewers, the last thing you want is to spend time investigating, especially when every second counts. That’s why we display our real-time metrics as trends. You can instantly see where there’s abnormal activity and have answers to those questions. If you do have to investigate further, this gives you a head start by pointing you in the right direction.
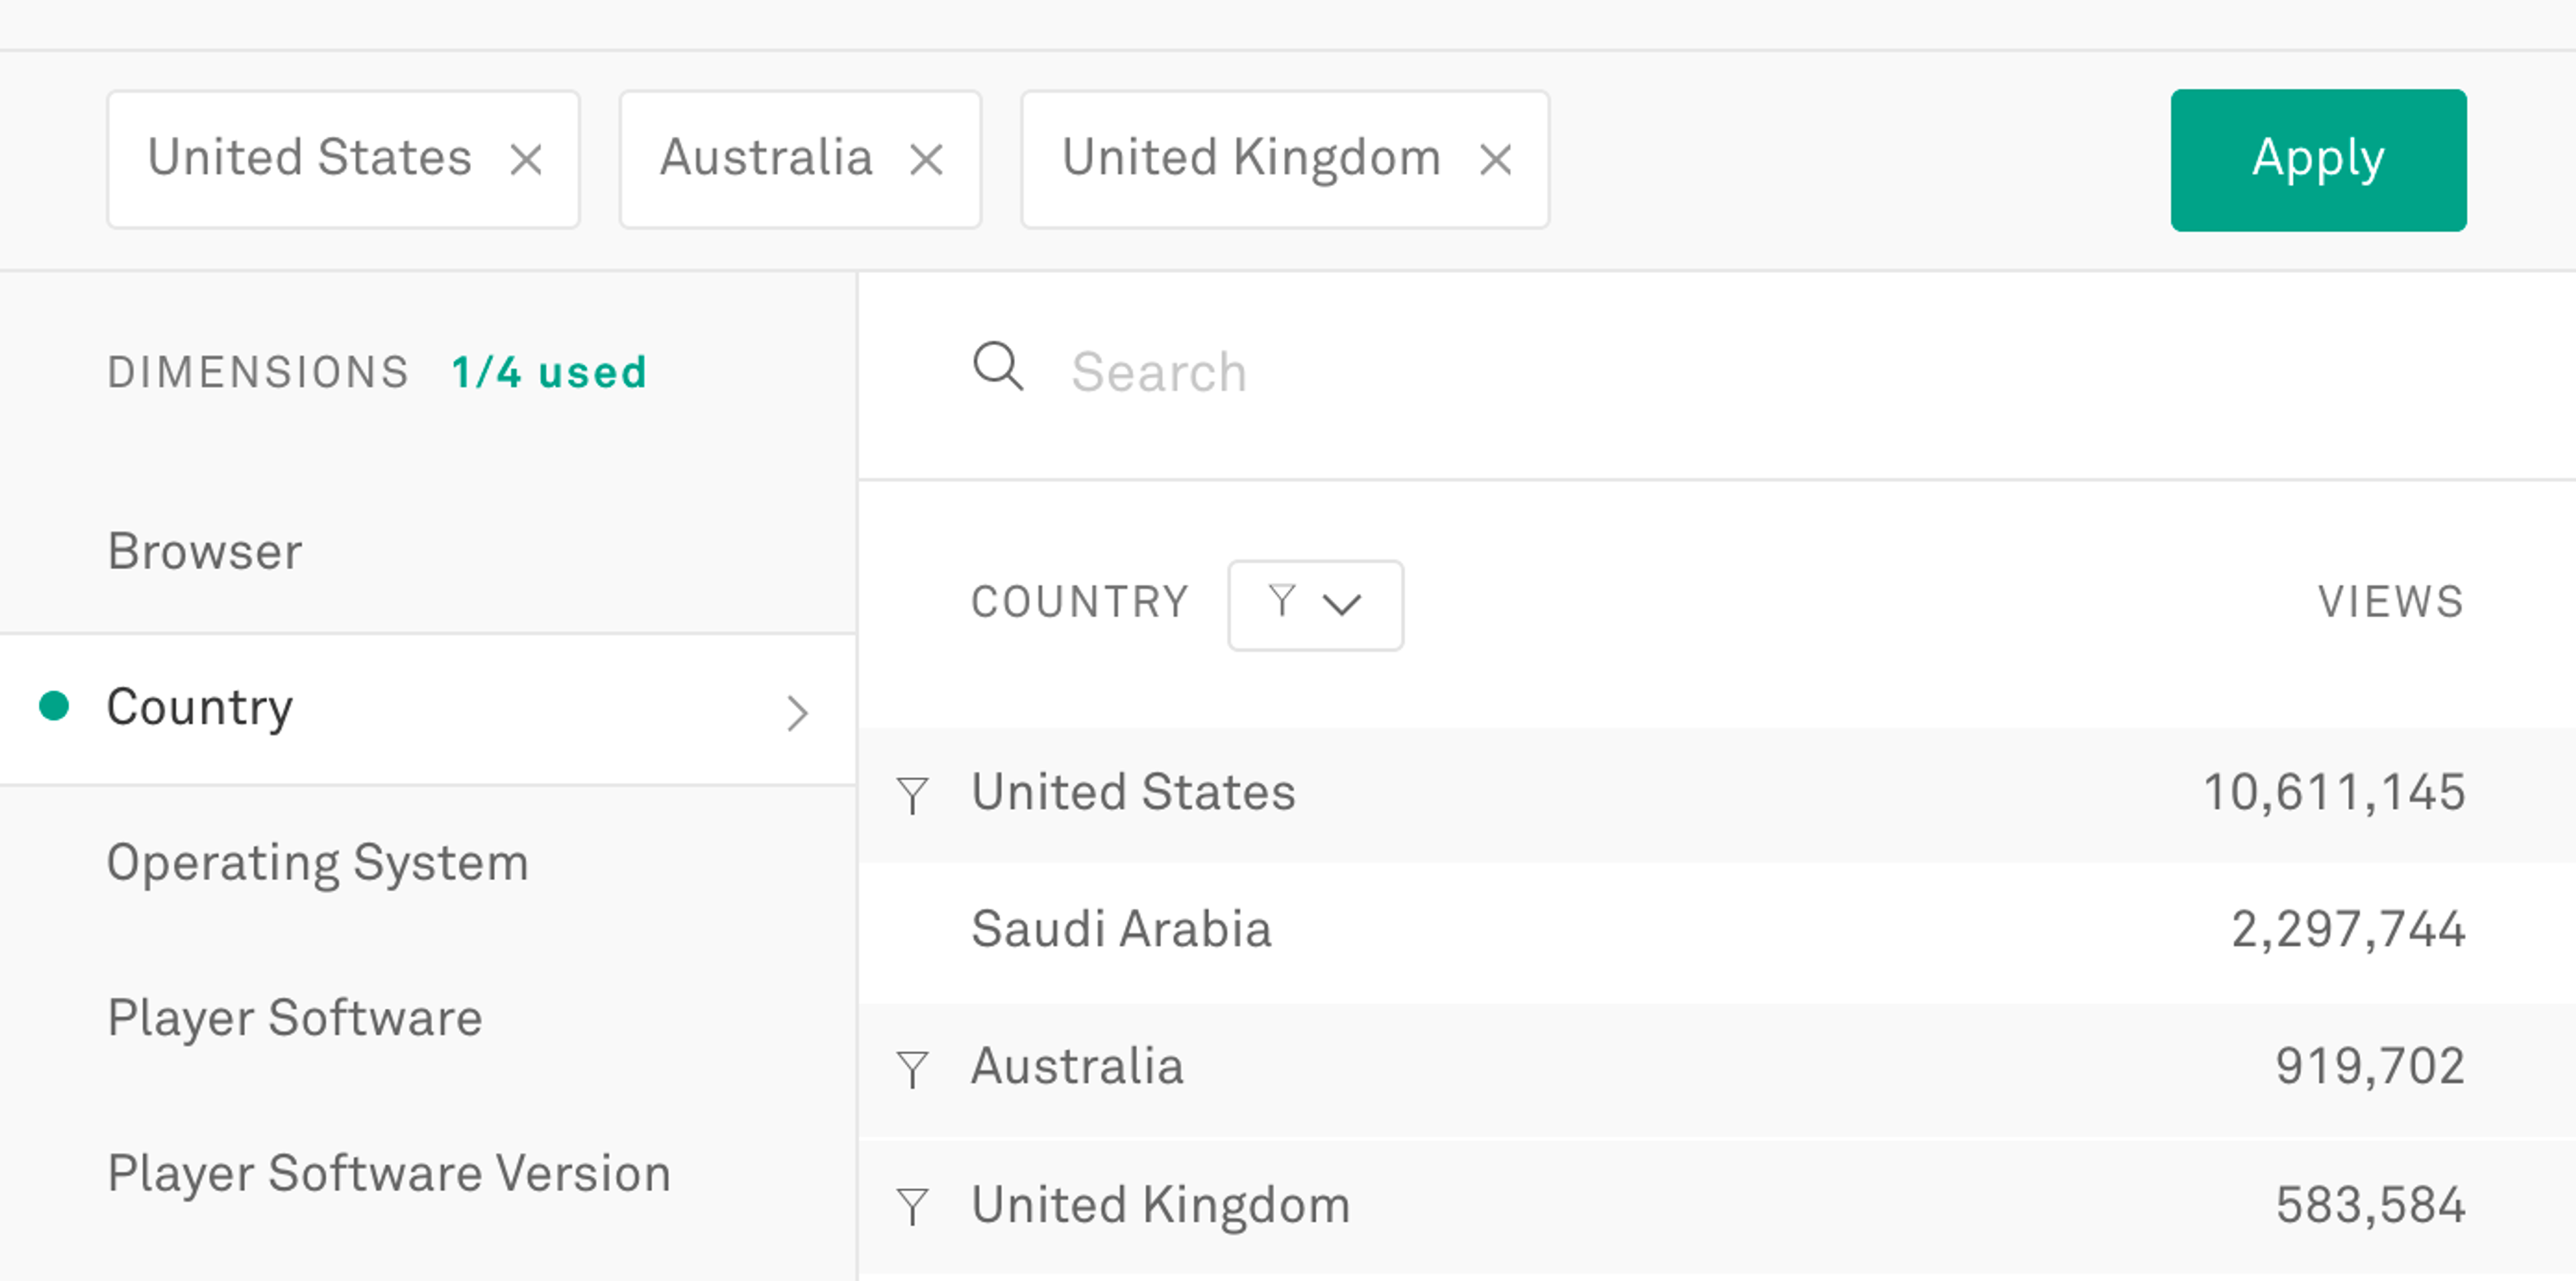
We’ve also added a new layer of data on top of the standard count of concurrent viewers. To provide more visibility, we display top titles by concurrent viewer so you can track specific streams in addition to total performance across your platform. Now you can easily see which streams are active and how they’re impacting overall real-time metrics. For example, you can see if the top five titles have an equal number of concurrent viewers or if there is just one that may be dominating your overall real-time metrics.
Track platform changes and inform infrastructure decisions
In addition to viewer experience, our real-time metrics can help you understand the impact of any development changes you make to your platform. You don’t have to experience a stream crashing first to identify an issue, you can monitor the development as it happens. Whether you’ve released a new feature or deployed system improvements, feel confident knowing that if there are any issues, you’ll catch them in real-time.
Plus, with visibility into the location and concentration of your viewers, you’re armed with data to better manage your network, whether it’s reducing costs or adjusting your distribution network to better service a certain region.
Complete visibility
One of our goals is to make compelling video experiences as accessible as possible. With our Real-Time Streaming Dashboard, you now have the monitoring tools to ensure you provide a superior viewing experience. Coupled with our Viewer Experience Metrics, you can answer critical questions that are vital to the current and future health of your platform and viewer experience.
Get the complete view of your streaming performance with the Real-Time Dashboard. Sign up to get a live product walk-through or get in touch to try it out.