
When designing the metrics for Mux Data, we focused on metrics that would inform you of the quality of your viewers’ experience and help you track down issues. We built out a robust analytics platform that provides both historic and real-time streaming data. However, before you invest in optimizing your video platform, you’d first want to know if your videos are gaining traction.
That’s why we’ve created Engagement Metrics. This new set of metrics can help you track the success of your videos and includes the following information:
- Views: The number of views that have a start time in the specified time interval.
- Unique Viewers: The number of unique viewers that started a view in the specified time interval.
- Playing Time: The amount of time that viewers played video (not including rebuffering, seeking, etc.). Playing Time can be reported as:
- Total - the overall number of hours that your viewers have played video.
- Average - the amount of video played per viewer.
- Median - how long the typical viewer has played the video (which is less susceptible to being skewed by a small number of viewers watching much longer than other viewers.)
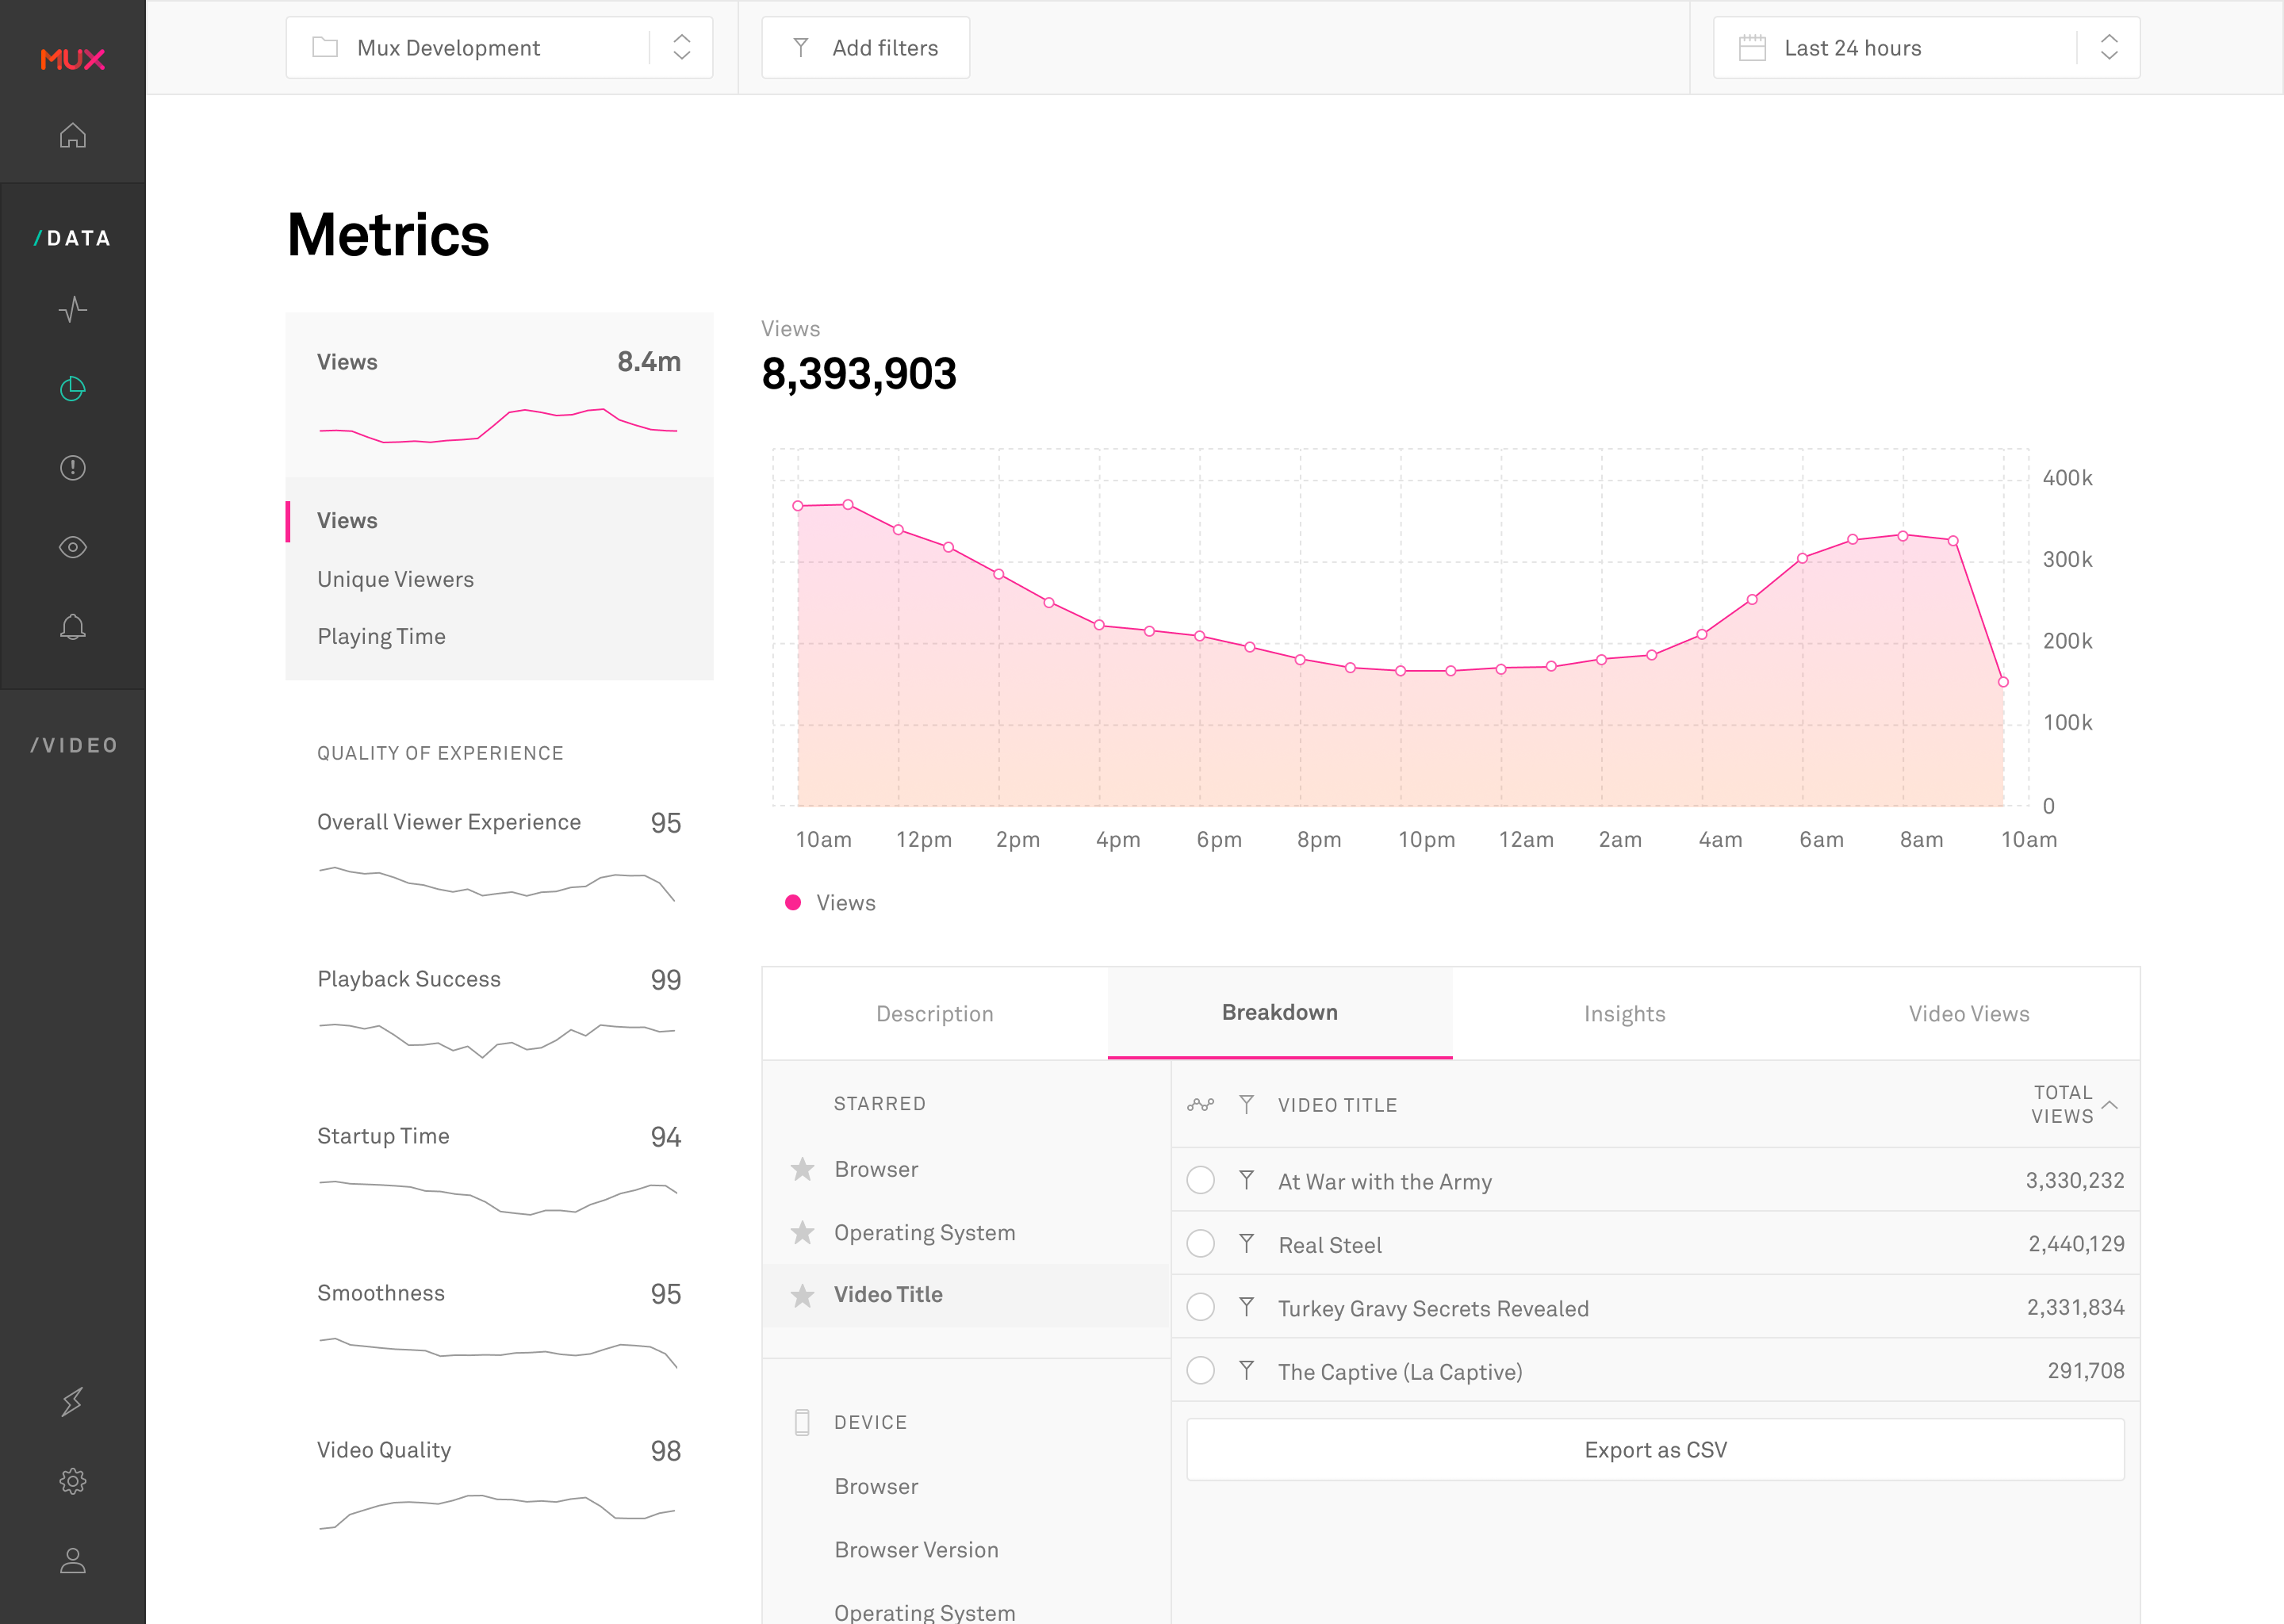
New view of Mux Data with Engagement Metrics
Let's talk about a few details on these metrics. A View is counted at the point when a user or application clicks play to start a video. If a video session results in an error before starting or if the user leaves before the video starts playing, it will be counted as a View. If you want to, you can filter out failures and exits before video starts using the metrics filters. Unique Viewers is similar, it counts the number of unique viewers that started a View. If a viewer starts multiple videos within a time period, the viewer will be counted once.
The last one, Playing Time, could use a little more explanation. There are a number of different ways to define something that sounds simple: the amount of time viewers spend watching videos. It’s difficult because there are a few different types of timings during a video view. Clearly, there’s the time spent with the video playing. But there are also other events that occur while watching the video that we need to consider, such as the time it takes for the view to start up, the time spent waiting for the video to rebuffer while it’s stalled, and the time during the video downloads content after a seek to a different location in the video.
Based on many discussions with development teams, most of the teams told us they want to focus their KPIs on the amount of time the video was actually playing. This definition is a bit different than some other video analytics tools, so it’s worth noting if you’re comparing Mux Engagement Metrics with other tools, but it aligns with what development teams are looking for and the Consumer Technology Association standard CTA-2066, Streaming Quality of Experience Events, Properties, and Metrics, where this value is called Play Time.
You can aggregate the data using the same large set of dimensions that currently exist for the Quality of Experience metrics. For example, you can report on the engagement differences per video, the performance of live vs. on-demand traffic, views per device type, distribution of traffic across your different player platforms, and many other metadata fields that are important to your team.
How to use Engagement Metrics
When we talked to customers, we found that these metrics were valuable to companies across industries of all sizes and to various teams: from developers monitoring their services, to product owners trying to understand the success of their product, to marketing teams needing detailed usage data. There are a variety of ways these metrics can be helpful, some examples are:
- KPI metrics: Track how many users you have this month vs. previous months and measure your success over time.
- Capacity Planning: For service capacity planning, teams need to know how many views you are actually serving for your events.
- Maintenance: Ops teams can have a quantitative measure of when during the day platforms are getting low traffic and can be taken offline for maintenance.
- Lifecycle Management: As traffic declines for older player versions, you’ll understand when it is time to end support for a player and the impact to customers.
- Success Drivers: Understand what content is the most popular and driving engagement in the platform.
With our historic Quality of Experience metrics, you can identify what’s causing issues. Engagement metrics, on the other hand, can show positive signals and growth.
"Mux's Engagement Metrics have enabled us to look at our popular content in completely new ways. By having a view into how long users are engaging with our content, we're able to redefine what popular means. To boot, we were also able to find a problem with a piece of content which was much shorter than our systems thought it was!"
Mark Bogdanoff, Software Architect and Video Tech Lead at TED
Availability
These first Engagement Metrics will be available for all Mux Data customers, in every plan (Lite, Starter, Pro, and Media) without charge. If you use Mux Video, don’t forget that the Mux Data Starter plan is included for all customers. 🎉
These metrics will be turned on and should automatically show up in your dashboard. Plus, all data for Engagement Metrics will also be available via the existing Data API and the data exports.
Note on availability: To report on the Playing Time engagement data, you will need to make sure that you are using a recent version of the Mux SDKs you have integrated in your players. For iOS and Roku specifically you will need up-to-date releases.
Native Player SDKs | Version required |
|---|---|
iOK SDK | 3.2.1 or newer |
Roku | 1.0.3 |
AVPlayer SDK via Swift Package Manager or CocoaPods | 2.20 |
We hope having these metrics will help you track and manage your videos and contribute to your success. Most of our features are customer-driven, and this is no exception. Let us know what other metrics would be valuable–we welcome the feedback!