Mux has been a long-time user of Apache Flink for stream-processing applications dating back to 2016. In this post, I’ll describe the path we’ve taken with Flink, the lessons learned along the way, and some improvements we hope to implement in the near future.
Our journey running Flink in the cloud
The Mux Data product was launched in 2016 after Mux emerged from Y Combinator. The majority of our stack ran on Rancher, a container orchestration platform similar to Kubernetes. This included our first Flink cluster, cobbled together with a hand-built Docker image.

In 2017, we began experimenting with self-managed Kubernetes in AWS. During that time, we migrated most of our Mux Data stream processing applications, including Flink, from Rancher to Kubernetes. This was fairly painless since we simply had to port the environment-variables to the YAML configuration file used by Kubernetes.
That same year we also began work on Mux Video, including the building of Flink applications for CDN log-enrichment and windowed usage aggregations which we still use to this day. Again, one of the most impressive things about Flink has been its ability to scale with our company’s growth with very little modification to the Flink applications.

Most of our Flink applications take job arguments that enable us to run several variations of the same Flink application (e.g., log-enrichment for CDN X, log-enrichment for CDN Y, etc). This has contributed to an increase in the number of jobs we run as the number of integrations in our data & video products continues to grow.

Recently we began leveraging Stream SQL in Flink applications for Data. Stream SQL makes it extremely easy to create streaming windowed aggregations, which have been the best use for Flink at Mux. It’s easy to see the number of Flink jobs ballooning even further given the power of what can be achieved by applying a simple SQL expression to a data stream.
So let’s look at some of the lessons we’ve learned from running Flink in Kubernetes clusters over the last 4 years.
Lesson #1: One job per Flink cluster
Historically we’ve tended to run multiple applications on a single Flink cluster as a matter of convenience. Rather than spin up a new cluster, we just added more Task Managers to support the additional jobs. However, this has proven to be an antipattern as we’ve seen the resource requirements diverge for different applications on the same cluster.
Task Manager slots are an abstraction used to represent CPU & memory resources available on Task Manager. Slots are the mechanism for scaling a job. A slot is typically associated with a single CPU core, and a job that requires more CPU or other resources will typically be submitted with a higher parallelism across more slots.
All of the Flink Task Managers in a cluster are uniformly sized. Failure to set each Task Manager’s advertised slots to the right level of granularity could lead to large amounts of waste when running multiple jobs with different workloads in the same cluster.
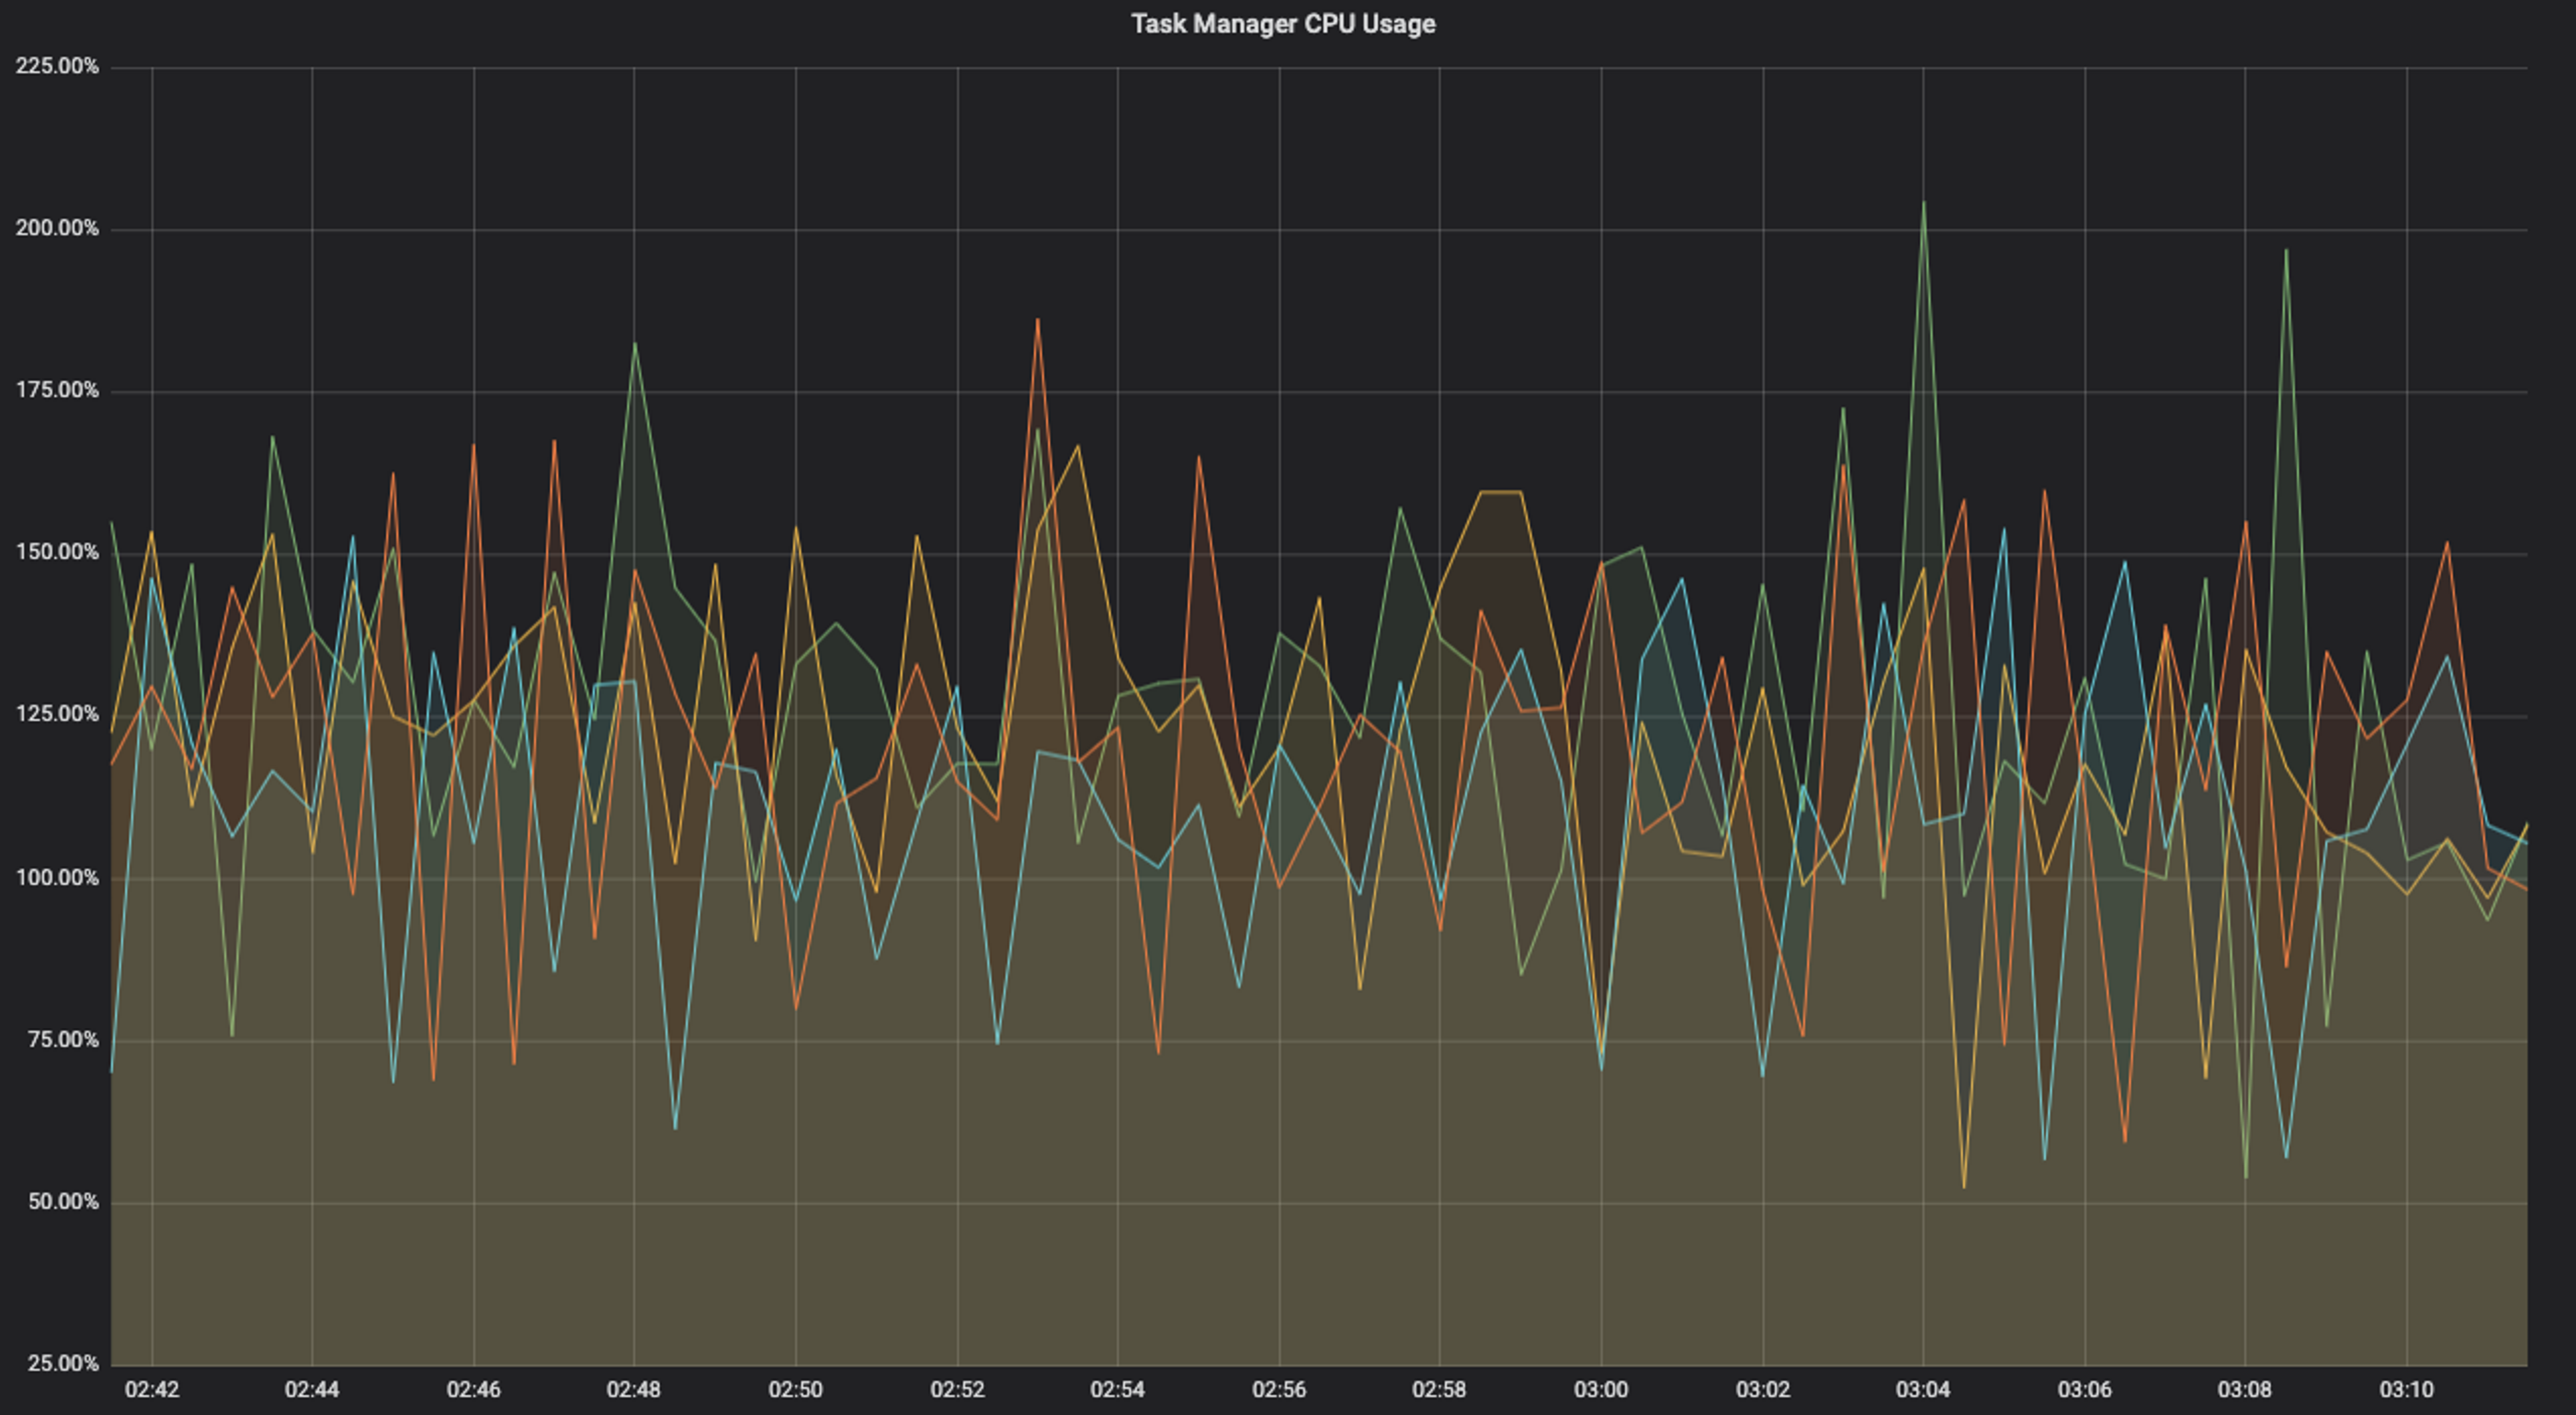
Ideally, the workload across all Task Managers in a cluster is uniformly distributed, as you can see in the Task Manager CPU usage chart below. This cluster is running a single job that’s able to distribute the load fairly evenly across Task Managers.

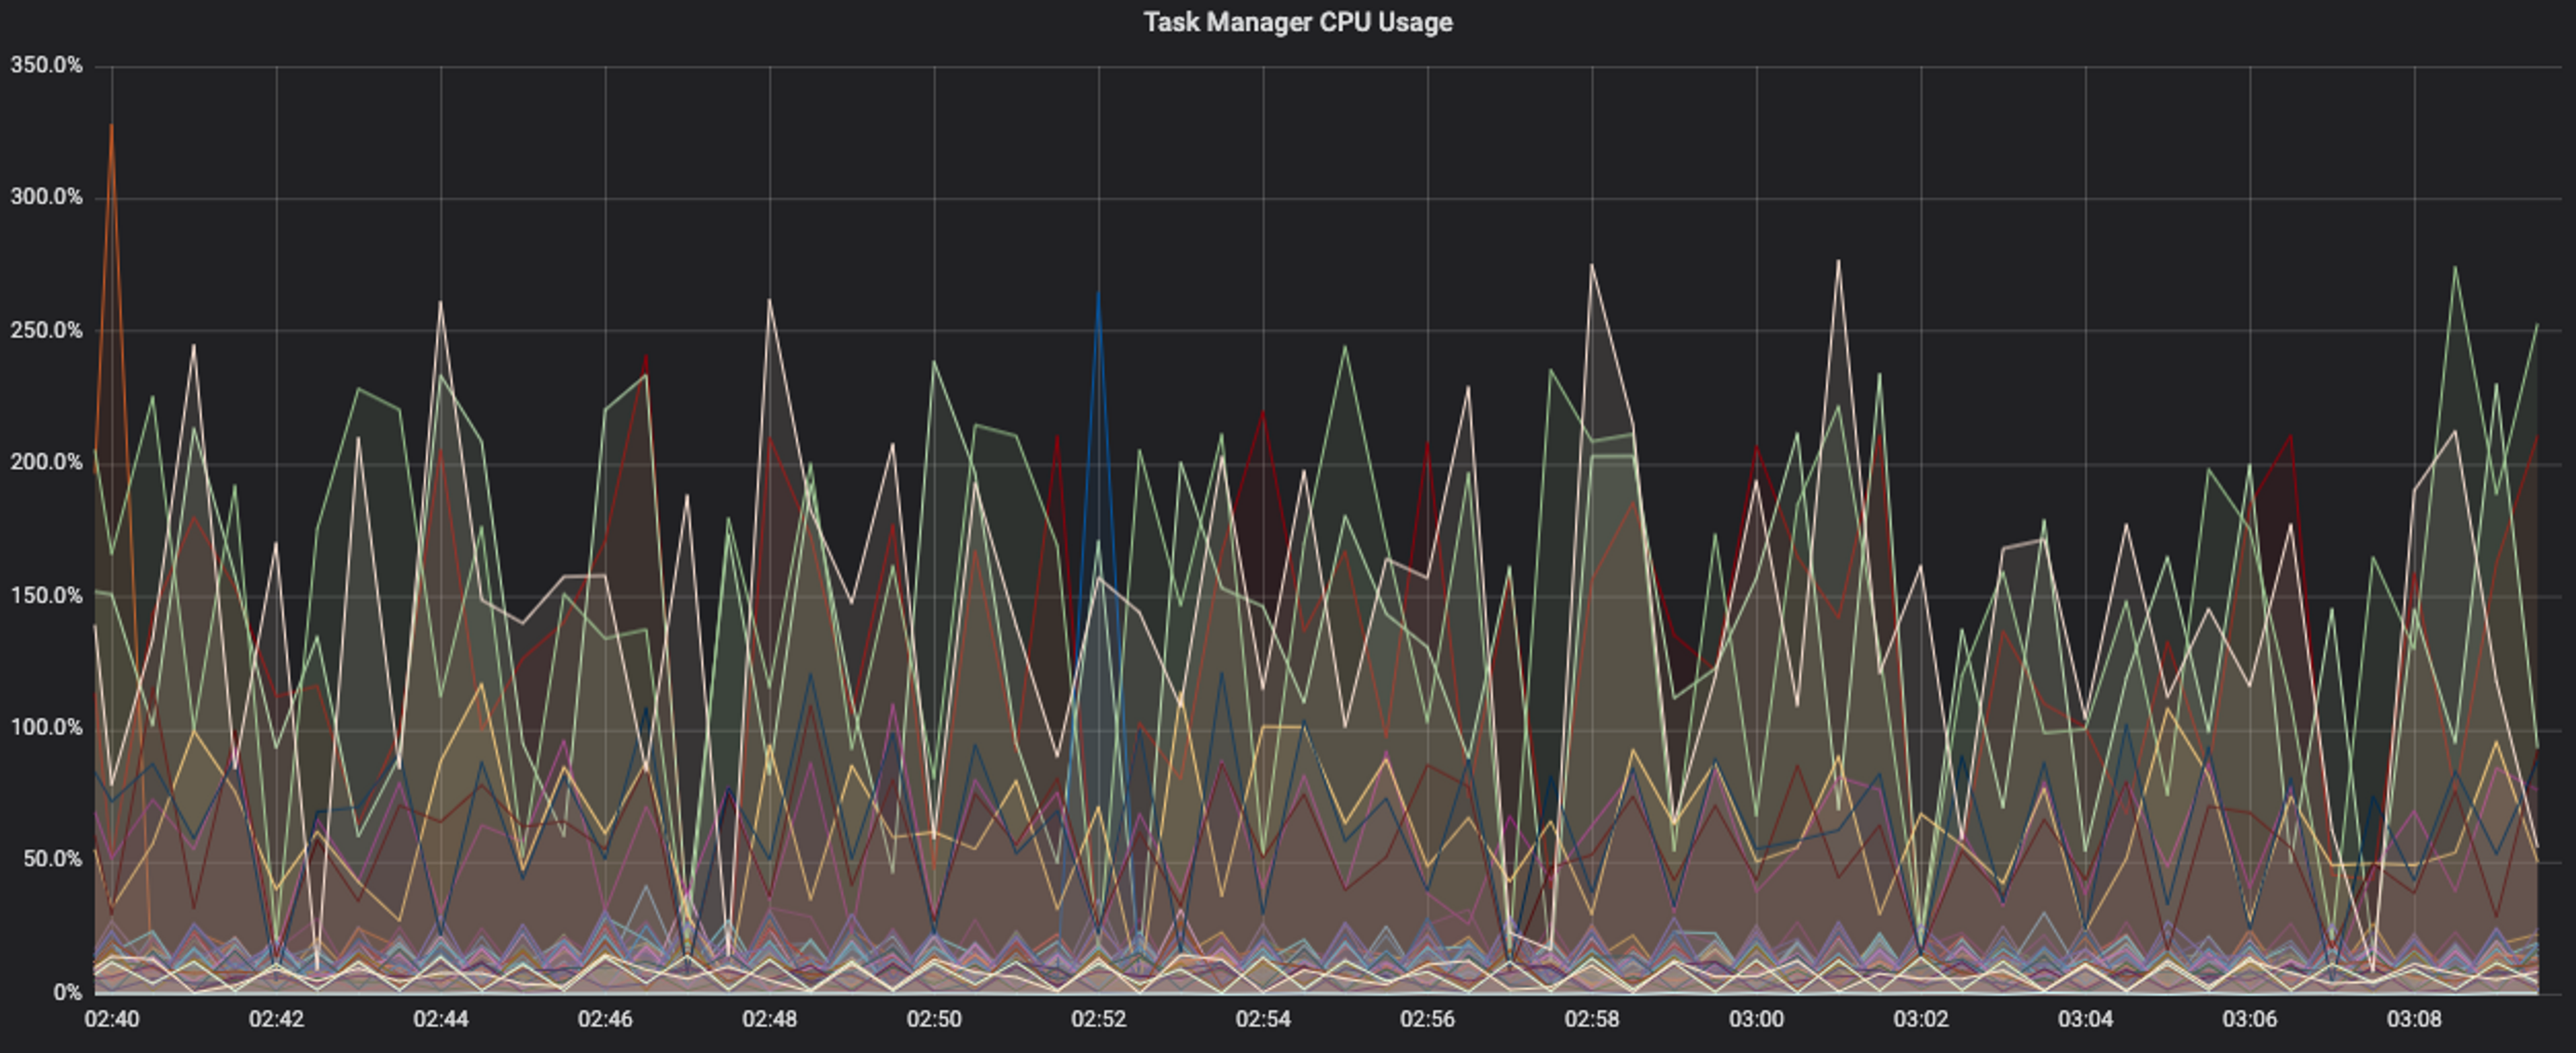
The following chart shows a different cluster with multiple jobs and an unbalanced workload across Task Managers. Some of the Task Managers are consistently using 100% of a CPU Core (e.g., 1 core), while many others are consistently below 20%, probably because their workloads are not CPU intensive. This is very cost inefficient since Task Managers in the cluster must be provisioned with enough CPU and memory to handle the most demanding workload, leading to some of the Task Managers being grossly underutilized.

Using a single cluster with multiple applications also makes it difficult to upgrade versions of Flink since it becomes an all-or-nothing proposition for each of the applications. By splitting applications out to separate clusters, you can upgrade the Flink clusters incrementally, possibly starting with applications that are less critical.
Lastly, having a single application per cluster makes for easier troubleshooting and operations. It’s easier to attribute a change in resource requirements or instability when there’s only one job running in the cluster.
Lesson #2: Use the official Flink Docker image
Building support for error-rate anomaly detection in Mux Data in 2016 was our first foray into Flink applications. The most common method of deploying Flink at the time was to install it on bare-metal or with YARN. We aimed to deploy on Rancher along with the rest of our applications, which meant running Docker containers with a Docker image. However, there was no official Flink Docker image at the time.
We created an automated build process in our Buildkite CI system that compiled Flink from source. There was a Dockerfile included in the Flink 1.1.x distribution that we used as inspiration. I cobbled together some shell-scripts that translated environment variables into Flink configuration file settings. Lastly, we also added third-party libraries to the Flink distribution to reduce the size of Flink application JAR files.
This all worked quite well for many years. But the process of building a new Flink Docker image could take 30+ minutes as Flink was built from source. Upgrading versions of Flink also introduced incompatibilities in the shell scripts we’d written.
So, earlier this year we took the plunge and switched our Mux Data Flink clusters to use the official Flink Docker image. The Flink project has maintained Docker images since 2017; the official Flink images provide the quickest path to running Flink in Docker. We still have a Buildkite CI process that constructs our own Flink image based upon the official image so we can add libraries and configuration files, but the process is much faster (seconds, not minutes). We also gain confidence knowing that we’re using an image that’s been approved by the project. Building Flink from source is not a step we’d like to own.
Lesson #3: Add custom Prometheus metrics to your applications
As for monitoring frameworks on Kubernetes, Prometheus is the de facto solution. Most of the code written at Mux is in Golang, and the practice of instrumenting our code with Prometheus metrics is deeply ingrained in our culture. But for far too long we relied on the built-in Flink metrics or application logging to get visibility into application performance; it was time to add custom metrics to our Flink jobs.
We began with the Flink job used to enrich Mux Video CDN log records. This job creates an ephemeral LRU cache scoped to each Task Manager slot, and is used heavily during the log enrichment process. We needed visibility into the cache hit-ratio to see how cold-starts were impacting performance.
With Flink this was as simple as adding counters to the execution context:
We simply increment the counters each time a cache lookup occurs. The metrics reported by the individual Flink Task Managers are collected by Prometheus. We have a Grafana dashboard containing Prometheus queries to sum the individual Task Manager stats and reveal an overall cache-hit ratio.
Lesson #4: Disable DNS caching
The JVM will cache DNS entries forever by default. This is undesirable in Kubernetes deployments where there’s an expectation that DNS entries can and do change frequently as pod deployments move between nodes. We’ve seen Flink applications suddenly unable to talk to other services in the cluster after pods are upgraded.
We’ve addressed this by disabling DNS caching in our Docker image based on the official Flink Dockerfile. This has no significant negative impact on the performance of the application and ensures it can respond to DNS changes.
The following Dockerfile shows how we've disabled DNS caching in the JVM:
Lesson #5: Use the new Flink memory management model
Flink 1.10 introduced a new memory model that makes it easier to manage the memory of Flink when running in container deployments. This change, combined with the switch to the official Flink Docker image, makes it extremely easy to configure memory on the Flink Job Manager and Task Manager deployments.
Here’s an abbreviated example of how to supply memory management settings to a Flink 1.10+ deployment in Kubernetes:
This method requires telling Flink the amount of memory available for the entire process. Flink will then allocate appropriate amounts of memory for the JVM, network buffers, and the heap.
One operational gotcha we’ve had to make clear in our internal runbooks is that it’s essential to update the taskmanager.memory.process.size and jobmanager.memory.process.size settings when altering memory settings on the deployment; it’s not enough to just change the pod memory settings (commonly all that’s needed for most of our other Kubernetes deployments).
Don’t forget to set the managed memory settings appropriately depending on whether you’re using RocksDB or other off-heap memory. We currently do not use RocksDB, so we configure taskmanager.memory.managed.fraction to zero to maximize the available heap memory. The default behavior in Flink 1.13 is to devote 40% (0.4) of process memory to off-heap which could go to waste.
Future improvements
Flink will likely continue to play a role at Mux well into the future. There are certainly some improvements we’d like to make, mostly in the areas of developer experience with testing and deployment.
Deployment of updates to existing applications is our biggest paint point. Our application upgrade process involves manually stopping the running job, then resubmitting with a newer version of the application code.
We’d like to support automated application upgrades with CI/CD. We’ve been watching the Flink Kubernetes operator from Lyft for a number of years. However, the Native Kubernetes deployment of Flink looks like the most promising and straightforward way of deploying.
We’d also like to bolster the test coverage of our Flink applications by running full-fledged versions of the sinks, such as Kafka and Postgres databases, to ensure correct operation. We’ve got Cucumber integration tests in our staging environment to verify end-to-end performance. But it would be useful to have tests that can exercise the Flink application in isolation during development. Based on some rough research, the embedded Postgres database from Yandex and test containers have looked promising. These tools enable us to run a local Flink server with the complete pipeline and assert expectations on databases.
Wrap-up
Flink has proven to be a great technology for performing streaming aggregations and continues to find new use cases at Mux after nearly 5 years of production use. Its support for exactly-once stream processing and intuitive API are hard to beat. We’ve had some bumps along the way, but we’re convinced that running Flink on Kubernetes is well worth the effort.
If you’re interested in stream processing, particularly with Apache Flink, check out our jobs page. We’ve got a lot of high-volume stream processing applications that are sure to be of interest!


