Data features
Understand streaming analytics, monitor user engagement, improve the quality of experience (QoE) for your viewers, and more
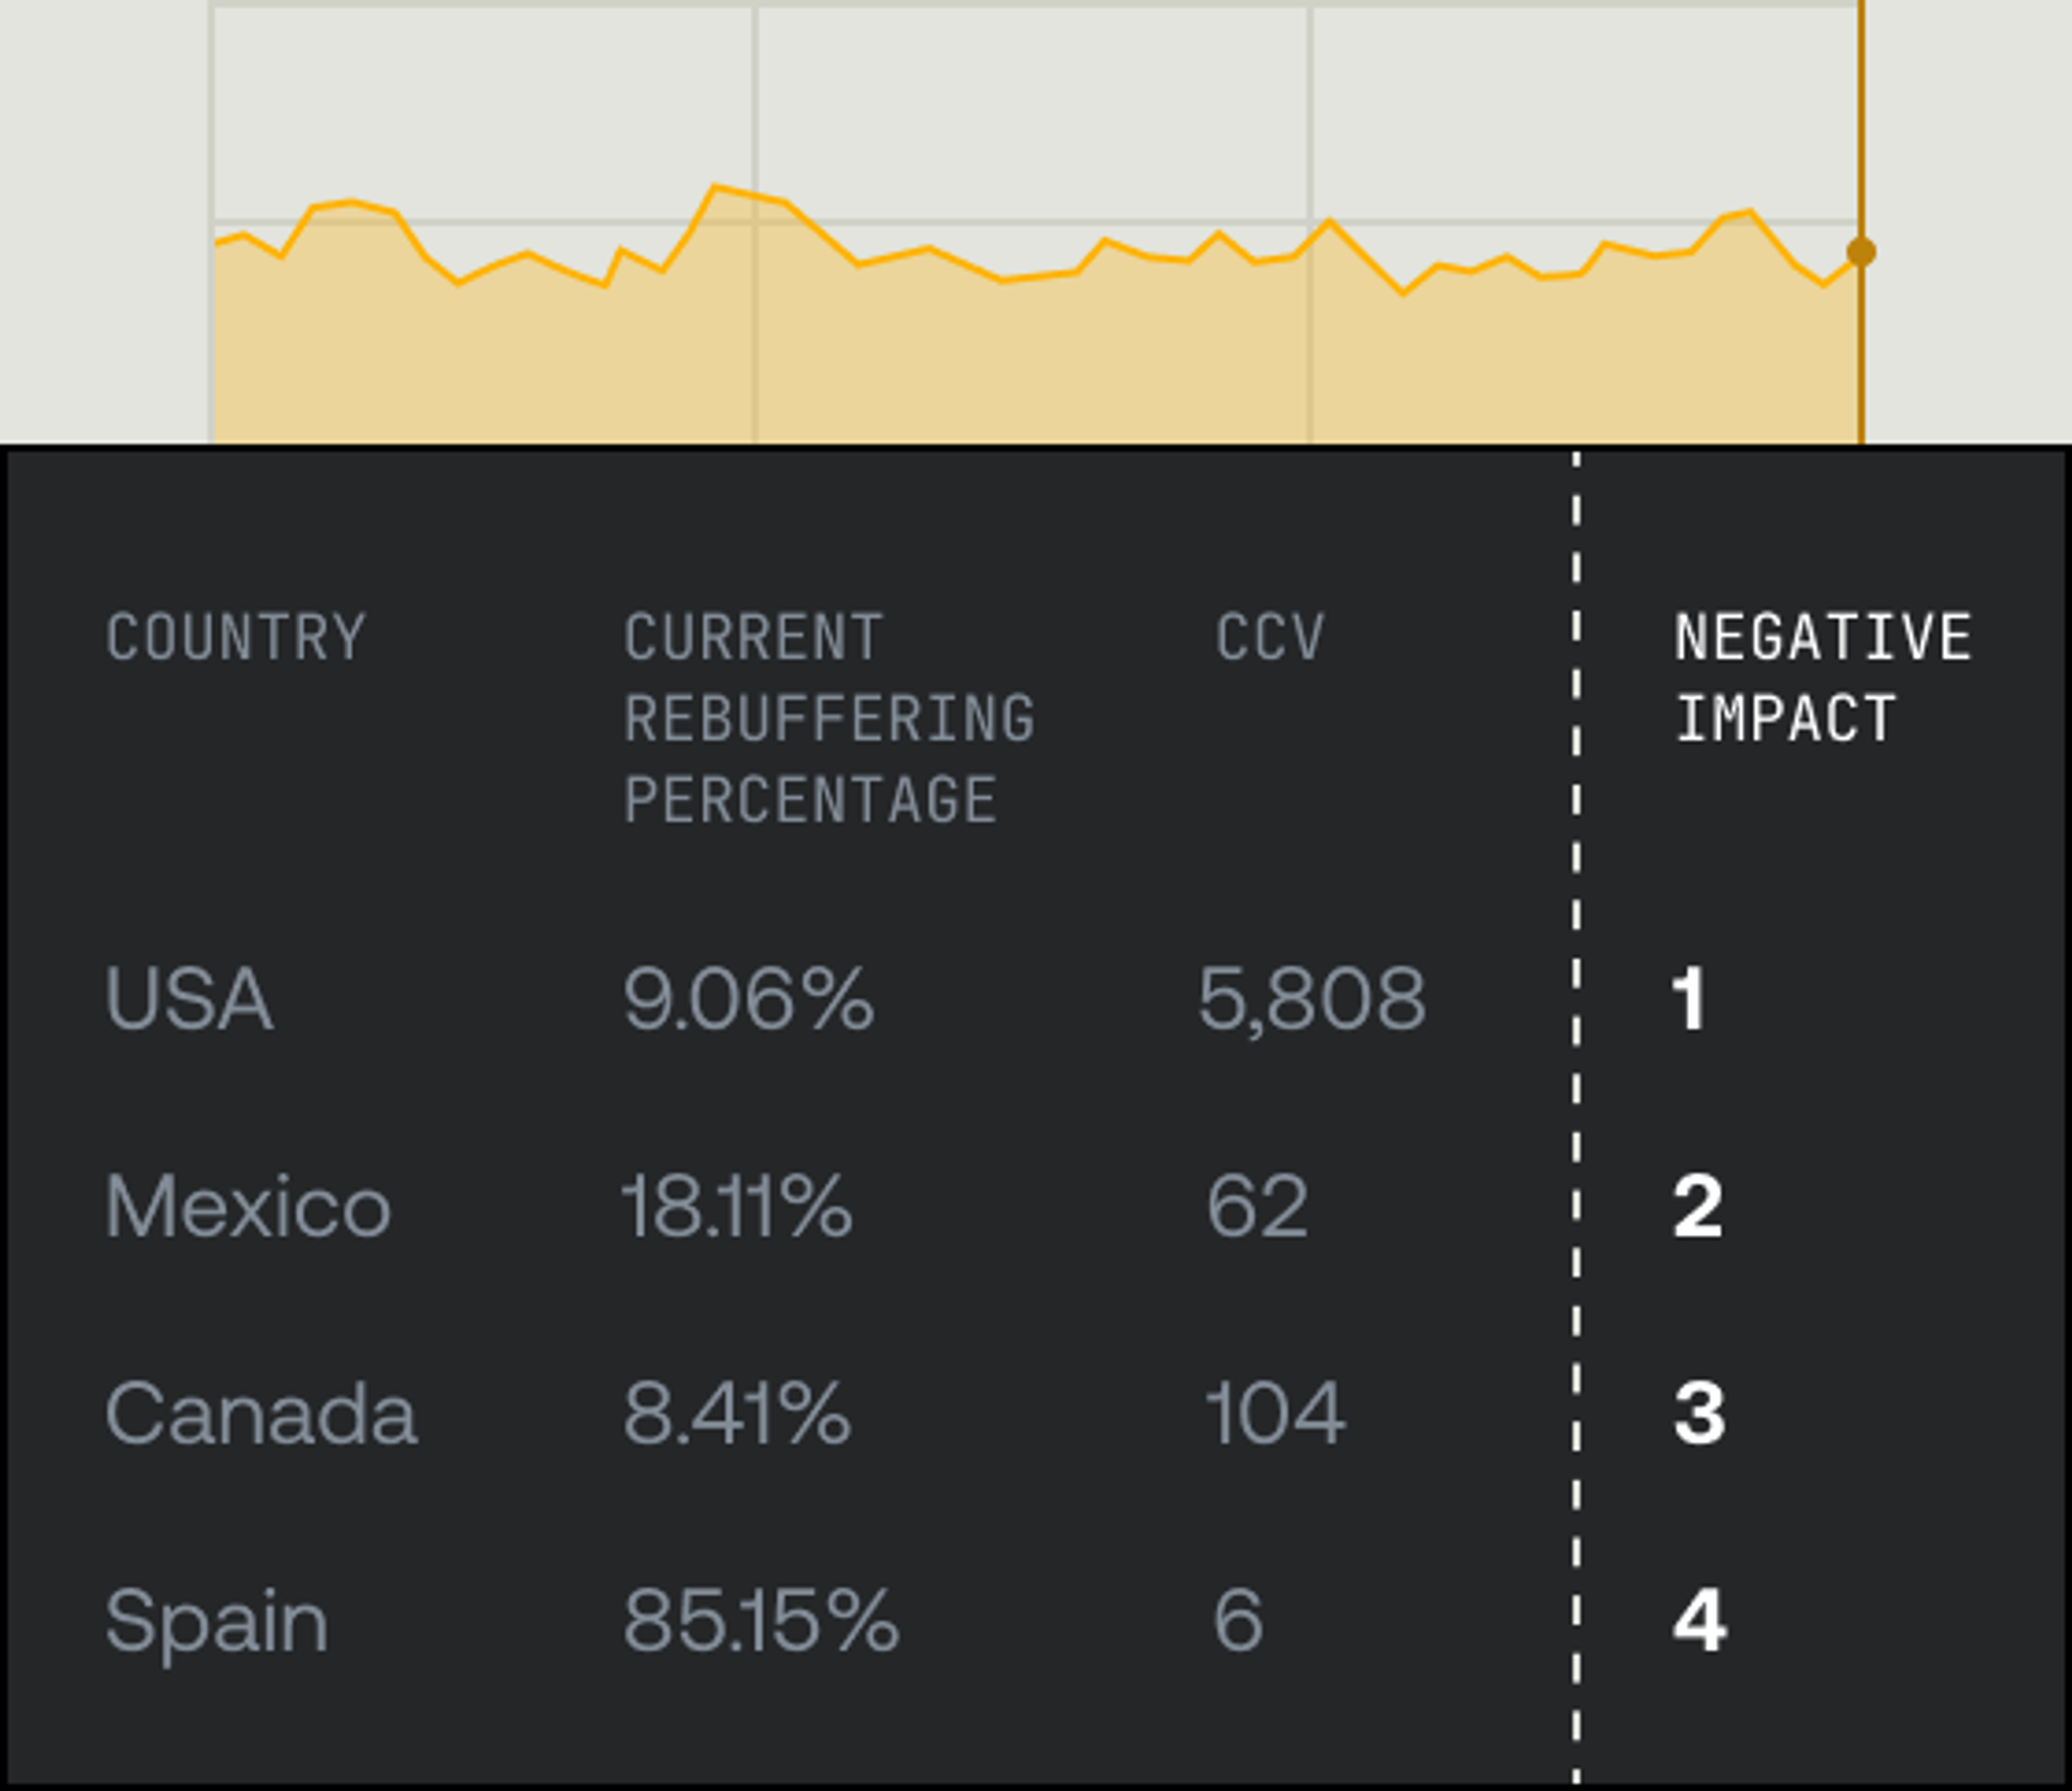
Negative impact score
Spend your time on the issues that will make the biggest difference for more of your viewers. The Negative Impact Score surfaces the actionable problems that have the biggest impact on your QoE. Available in real-time and historic metrics.
Real-time dashboard
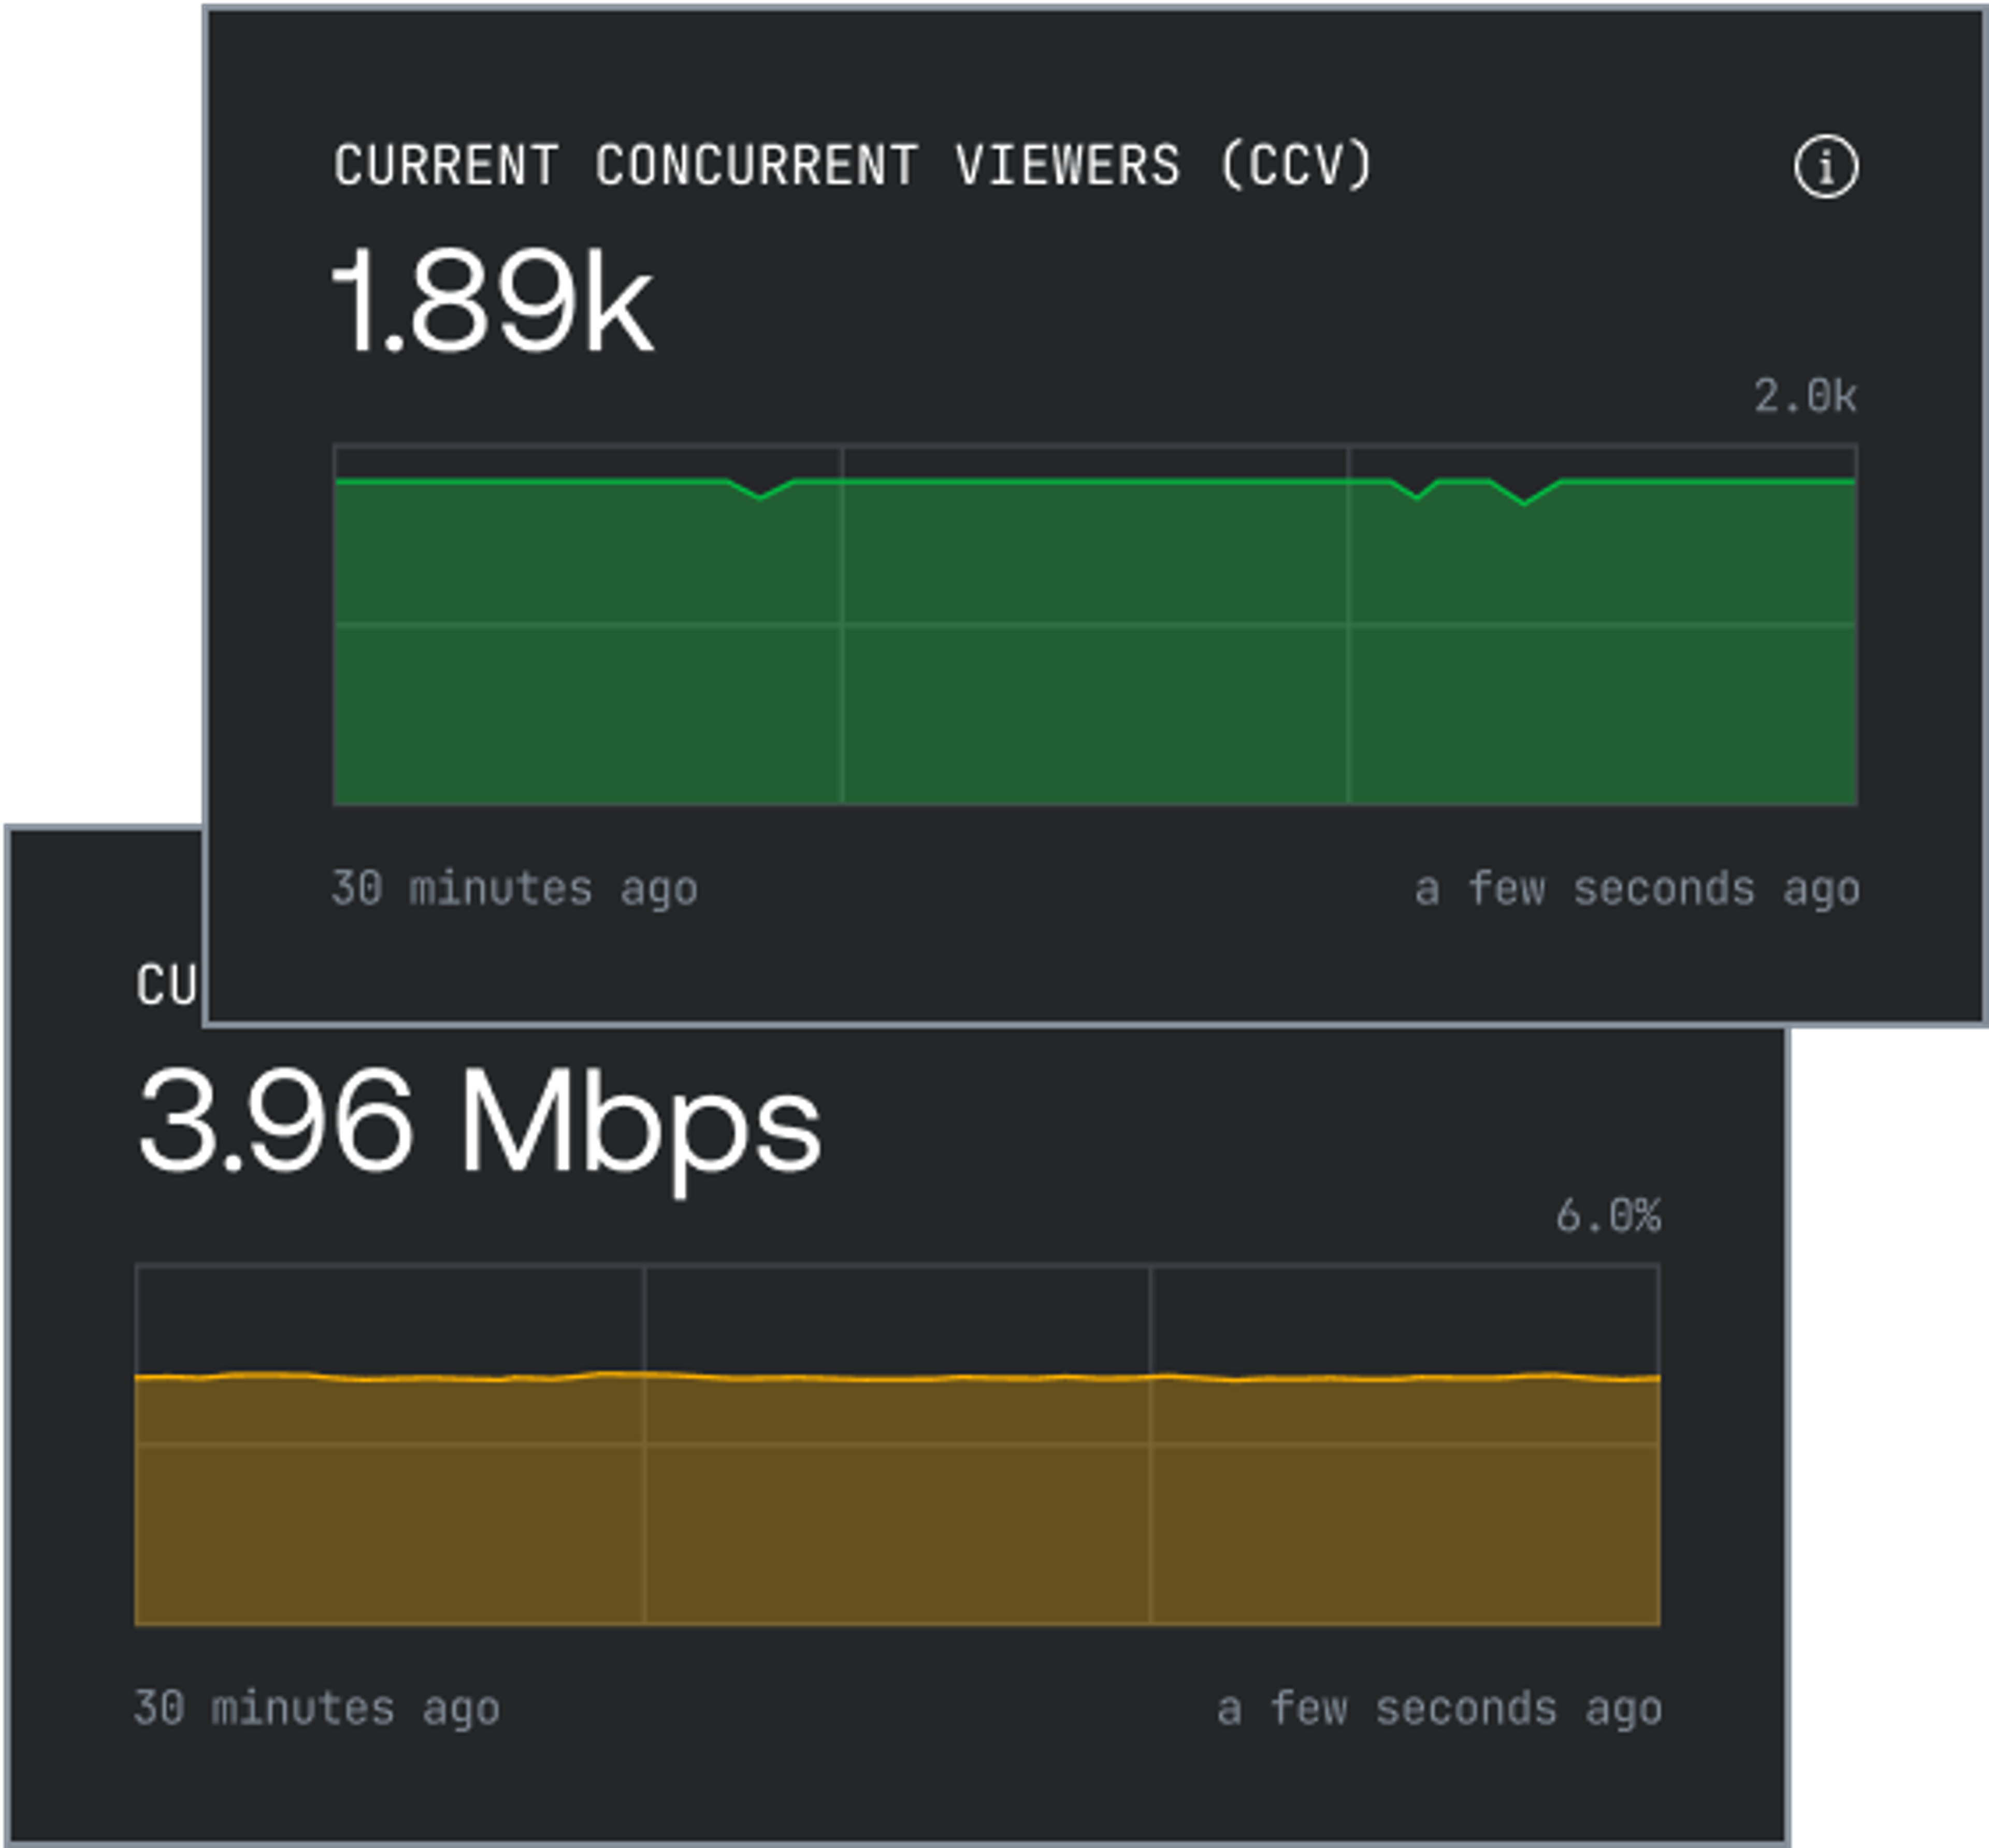
When it comes to live events or a big launch you always want to spot an issue on a dashboard before social media. With a latency of <20s, the Monitoring Dashboard serves as a virtual command center for your platform’s quality of experience.
Learn more


Data exports
It’s your data, get it where you need it. Access historical and real-time data through restful APIs, Kafka streams, and scheduled daily CSV exports of your data, and integrate seamlessly with the data tools you already use.
Learn more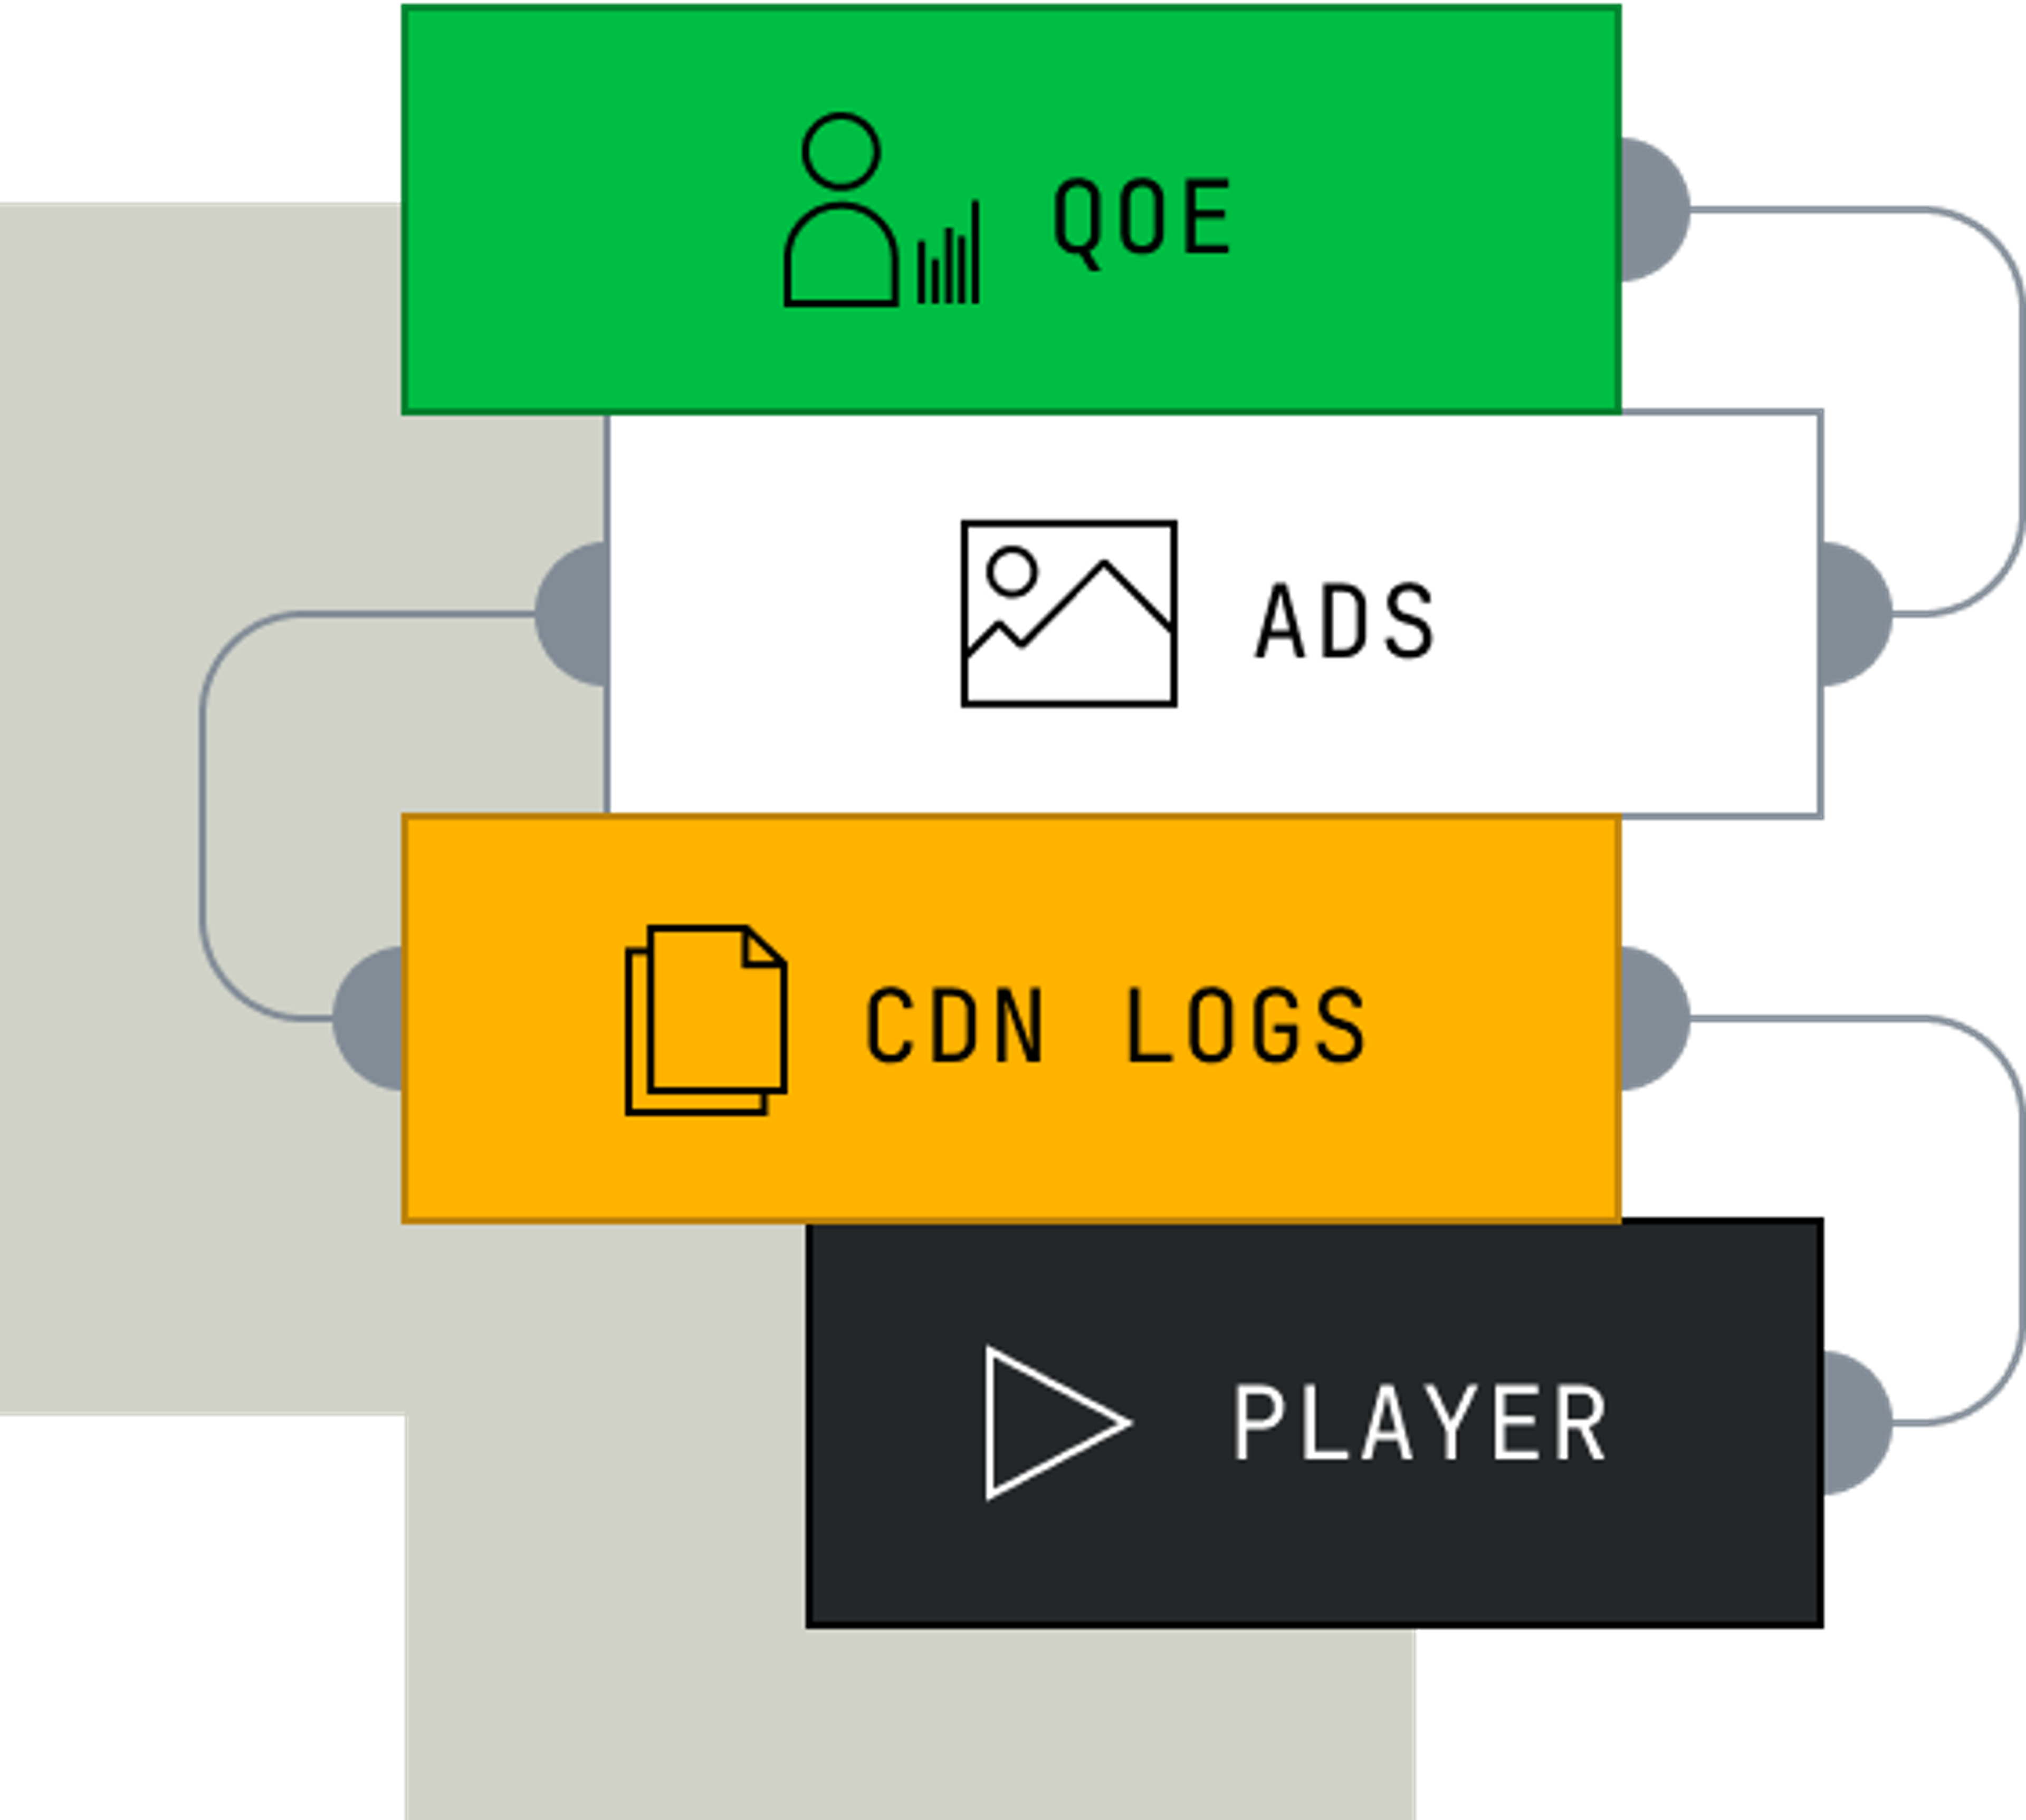
CMCD
Get the complete picture of your platform’s viewer experience by combining your client and CDN logs with Mux Data and CMCD. CMCD is supported in partnership with Akamai and other CDNs.
Learn moreHigh CCV capacity
Mux Data is built for scale and has supported the world’s largest streaming events, reaching even tens of millions of concurrent viewers. From global sports events to season finales of the most popular shows, monitor events without worry.
Pre-built integrations
Pre-built integrations mean you can get up and running quickly. Integrations include client-side SDKs for the most common video players on web, mobile, and smart TVs, as well as set-top boxes.
Historical dashboard
Use Mux's Metrics Dashboards to analyze historical trends and identify where to invest your development team’s time. Filter and drill down into past events and arm your support team with critical information to help your viewers.
Test and compare
Test new players, CDNs, encoding, or whatever else you’re rolling out. Understand the impact with A/B tests and metrics. Use the Compare tool to analyze metrics from experiments in a single view and quickly model all QoE scores across groups of dimensions.
Security and compliance
Mux complies with the following security and compliance frameworks
- EU-U.S. Data Privacy Framework
- UK Extension to the EU-U.S. Data Privacy Framework
- Swiss-U.S. Data Privacy Framework
With all the great things you’d expect in QoE analytics
Mux’s Monitoring Dashboard serves as a virtual command center for live streaming, monitoring video quality of experience. And with latency of <20s, you can catch issues before they affect most of your viewers. Understand the impact of any development changes on your QoE and provide your support team with real-time data.
Metrics monitored in real-time include:
- Video Startup failure
- Playback failure
- Current Concurrent Viewers (CCV)
- Exit Before Video Start
- Rebuffering
- Average bitrate
- Video Startup Time
- Map of where viewers are watching
- Top Titles by CCV
Mux Data is included with every Mux Video stream
Need to use your current video solution?
Get 100K monthly views for free
Additional views at $0.60/1000.
Need help?
Get support
Our engineers provide hands-on support via mux.com/support and email help@mux.com
Get set up
Integration is easy. Just sign up and follow the instructions in our docs.
No credit card required to start using Mux.