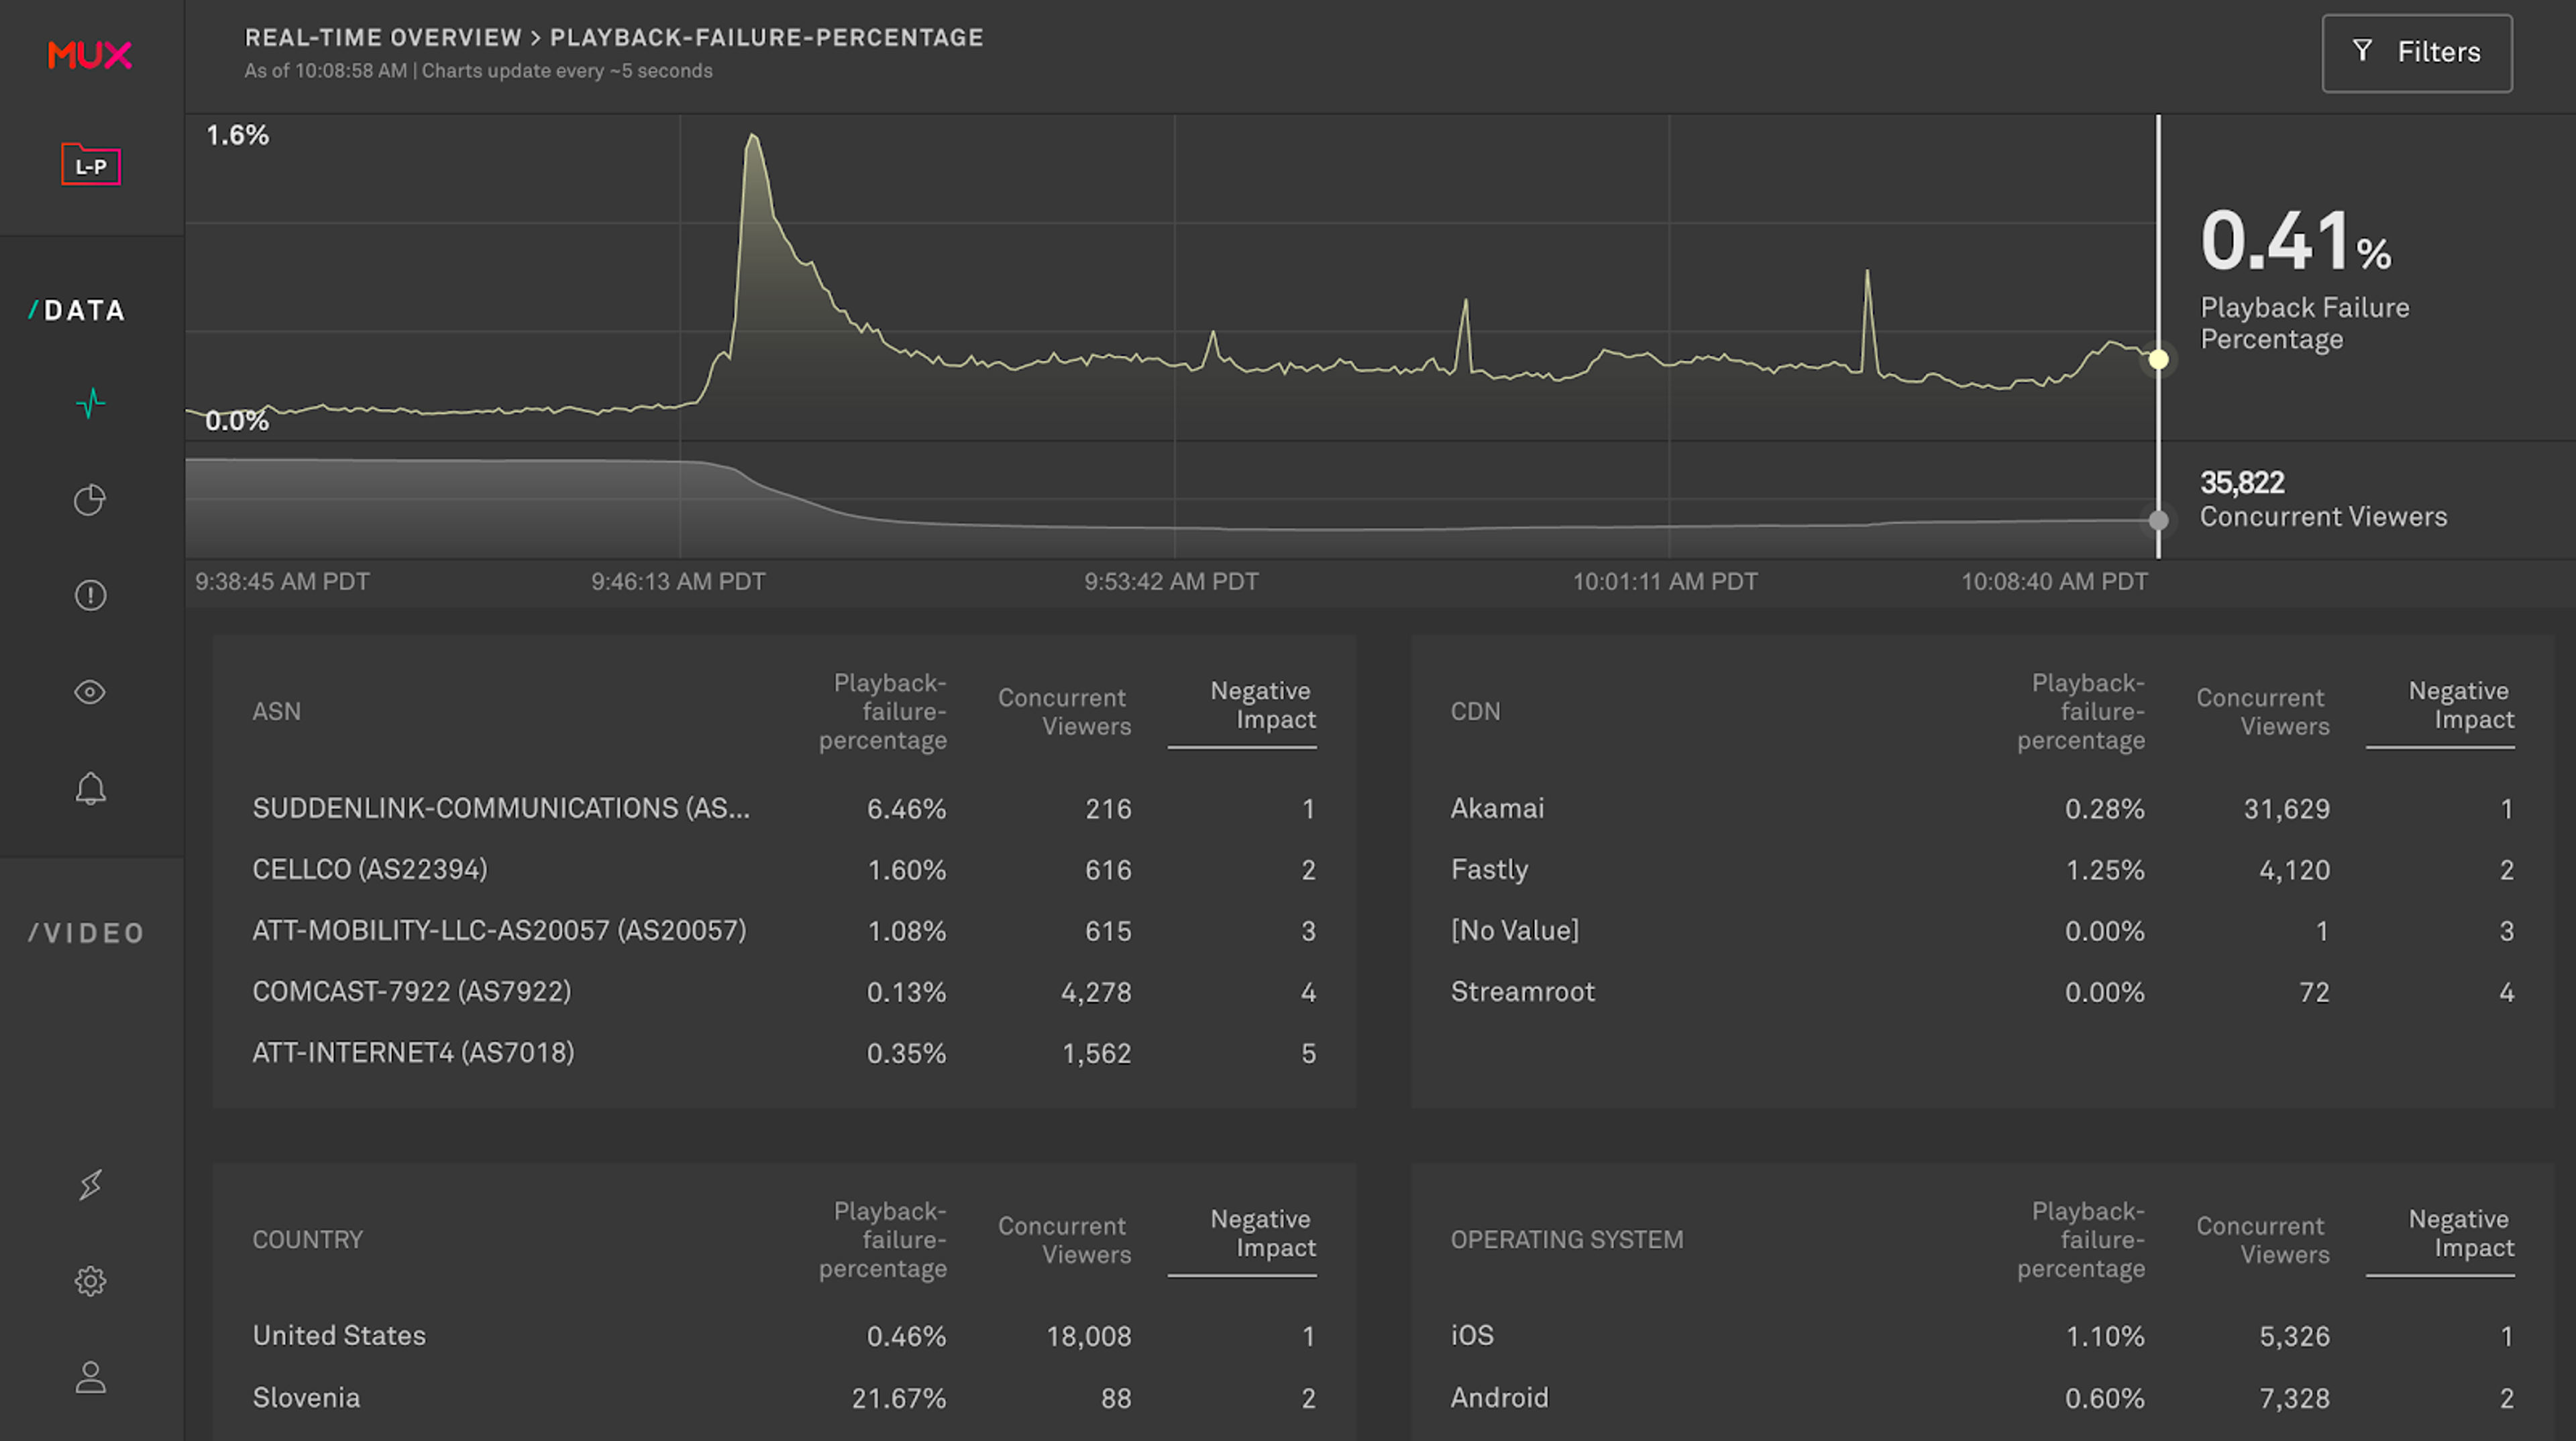
The Mux Data Real-Time Dashboard is a great way to monitor the performance and quality of your video experience. It is a real-time metrics dashboard of concurrent viewers and many of the important Quality of Experience (QoE) metrics you need to ensure a great video experience, such as: rebuffering percentage, failures, video start times, and exits before video start. The dashboard is updated every few seconds which makes it easy to spot issues as they occur so you can fix them as quickly as possible and minimize disruptions to viewers.
We love to see how the real-time data has been used: Mux Data customers have used the Real-Time Dashboard to successfully monitor extremely large events, like major sporting events, and small but important events such as online classes.
If you already have your own network operations (NOC) interface or central point of video reporting, you couldn’t export this data to your own dashboard. You would need to keep an eye on the Mux Data Real-Time dashboard in addition to your internal NOC. We know a single NOC interface is an important part of many customers’ monitoring infrastructure so we wanted to make it easy to use existing tools but still have access to the low-latency, real-time metrics.
We’re excited to announce the availability of our Real-Time Dashboard API. The new API endpoints provide access to all of the data that is displayed in the Real-Time Dashboard and at the same real-time latency and granular five second aggregation. The data is accessed via an HTTP API using the standard Mux access tokens and returned as JavaScript objects.
The Real-Time APIs are immediately available to all customers on a Media plan.
With the basics out of the way, let's walk through how you can access this data. If you’ve used other Mux APIs, this will largely be a review. For those new to using Mux APIs, you can follow this same process to access the many other APIs we provide to Mux Data and Mux Video.
At a high-level, the process is as follows:
- Create an access token in the Mux dashboard
- Call the Real-Time API
- Ingest and display the data
Create an Access Token
To call Mux APIs, you need an access token and secret key. They behave like a username and password that you can use to safely call the Mux APIs without having to worry about exposing your login credentials.
To create an Access Token:
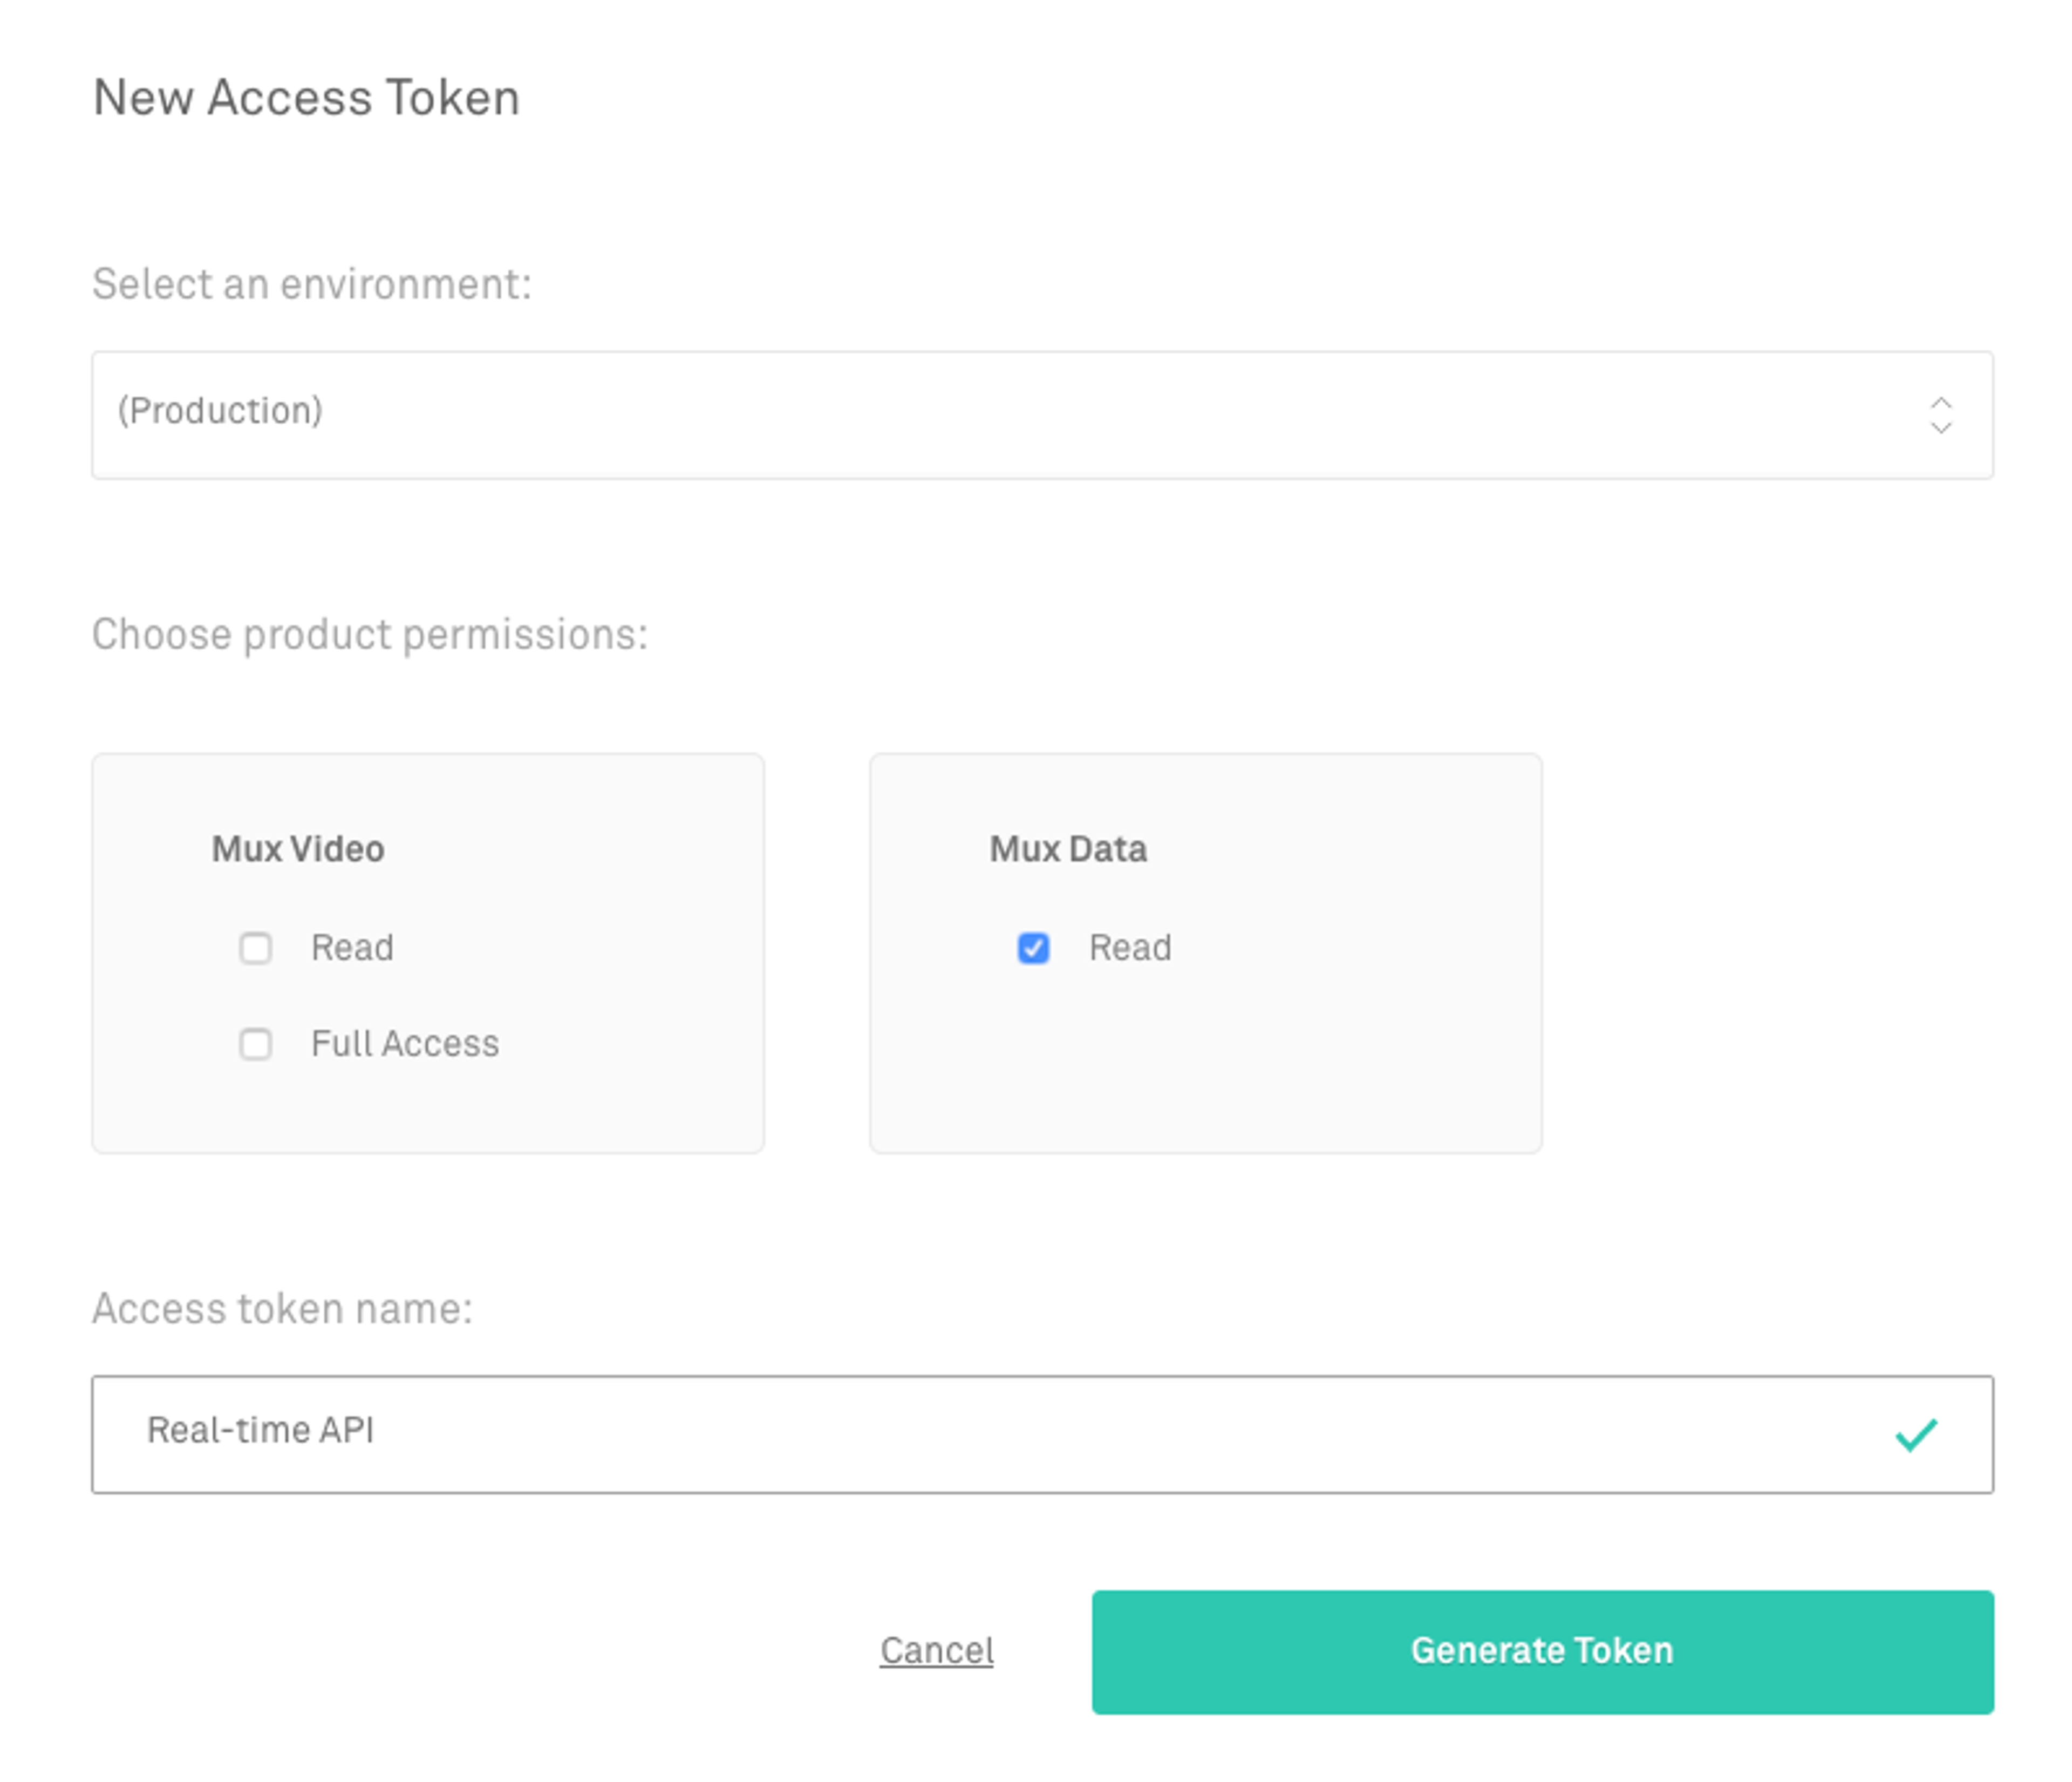
From the Settings Menu, choose Access Tokens
If you don’t already have an access token, click the “Generate new token” button.
- Select the environment you would like to access, most likely the environment with your production data
- Choose the Mux Data: Read permission, this will allow the token holder to access the reporting APIs. Other permissions are also available for reporting and managing Mux Video, though I suggest you create separate tokens for these tasks to minimize the risk of illicit activity if somehow a token does get shared publicly.
- Give the token a name so you know what this is for, call it "Real-time API"
- Click the "Generate Token" button
An Access Token and Secret Key will be created for you. The secret key is not stored and is not available to re-download so be sure to store the secret key somewhere. You can copy out the value or download a file with the secret key to put in a safe place.
Click “Continue” and you’ll return to the Access Token screen where you can find all your tokens and later create or delete a token.
Call the Real-Time API
You are now ready to call the API to extract real-time data.
For reference, you can find documentation on all of Mux Data APIs here: https://api-docs.mux.com/
For this example, I’m going to use the curl utility to call the APIs but you are free to use any tool that can make HTTP requests. The responses have been formatted for better readability.
You can set the access token and secret in environment variables or include them in the call to the API.
Set access token and secret in environment variables (replace with the values you got from the Mux Dashboard):
To help build automated reporting, the Mux APIs allow you to get a list of the metrics and dimensions that are available for reporting. Let’s take a look at what is available:
Great - we’re getting a response from the API! Now let's get some data.
The first thing I want to do is extract the history of the Current Rebuffering Percentage value over the last 30 mins. We’ll use the timeline endpoint for the current-rebuffering-percentage metric that will provide the rebuffering percentage metric aggregated in 5 second intervals.
To get more detailed rebuffering metrics, breakdowns allow you to group and filter the data in flexible ways that allow you to compare the metric across dimensions. You call the real-time metrics breakdown endpoint for current-rebuffering-percentage. In addition to the specific metric, you will need to choose the dimension by which data is grouped. Let’s look at rebuffering by country:
That’s useful but you can also focus on just the countries that you’re interested in reporting on in more detail. We’ll add a filter for the United States, Canada, and Italy.
Ingest and display data
As we worked through the beta release with customers, the Real-Time API has been used to integrate real-time data with a number of services. From one-off internal tools to centralized reporting services like Grafana, the Mux Data Real-Time API is an easy way to get real-time video reporting in your internal NOC.
If you end up doing something useful or fun with the real-time data, we’d love to hear from you about it. Drop us a line and let us know how it’s working for you.