ClickHouse is optimized to handle ingesting and aggregating large amounts of data for analytics workloads. But even with its strengths, our team encountered significant performance bottlenecks in our ClickHouse cluster, particularly during the ingestion of high-volume real-time data through Kafka.
These performance issues manifested during periods of increased query load, as one might expect. Our Monitoring Dashboard became visibly delayed and response times climbed from 100ms to upwards of 10s as the number of queries grew. What baffled our team, however, was that this performance degradation occurred despite the cluster showing only 60% CPU utilization. With on-call engineers stressed and worn down by what seemed like weekly incidents, we had an urgent problem on our hands - one that throwing more hardware at would not fix.
This blog post outlines how we identified and fixed this bottleneck, which turned out to be a classic trade-off between latency and throughput. For those working with ClickHouse Kafka Table Engine or facing similar challenges, we describe a method to measure the latency of ingestion —a metric that, at the time of writing, ClickHouse does not expose out of the box. Measuring the latency in this way was crucial for us to elucidate the problem. We hope it helps you too.
Latency vs. Throughput: The Key Trade-off We Missed
When we initially launched our revamped Monitoring ClickHouse architecture, our focus was squarely on optimizing throughput. Throughput in this context is defined as the number of rows that are inserted over time. Since we had introduced Kafka Table Engine to ingest data directly into ClickHouse rather than insert this data via an external service, we wanted to make sure the throughput did not suffer as a result.
At a high level, setting up ClickHouse to read from Kafka looks like this:
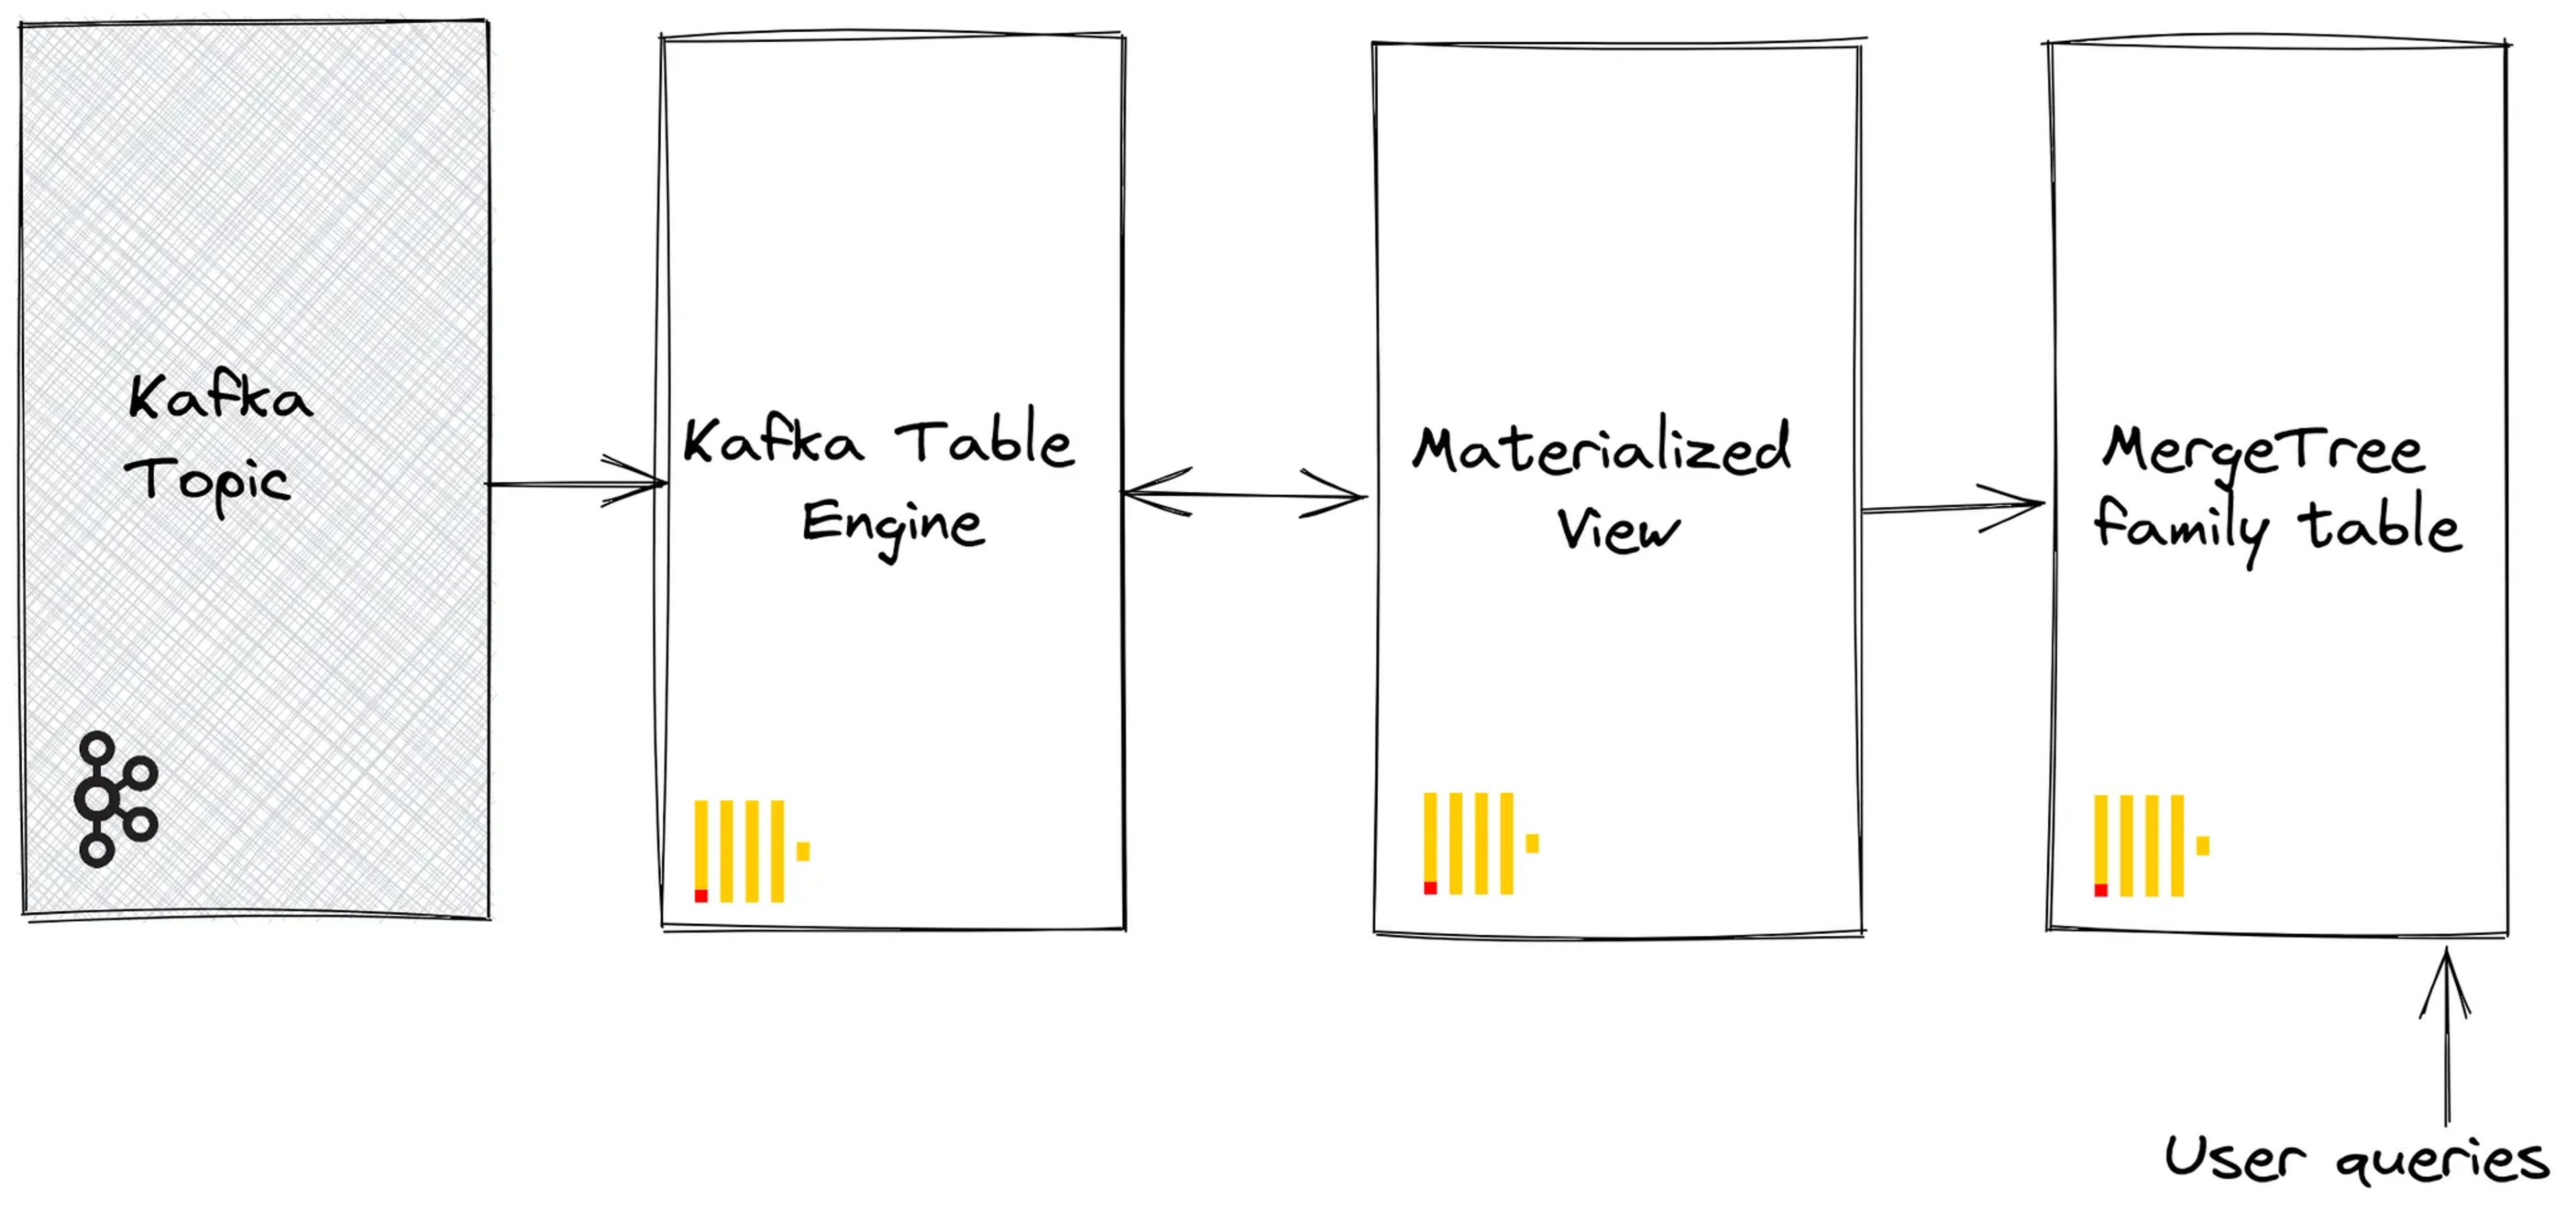
We set up Kafka Table Engine to consume messages from Kafka, with a materialized view that populates a destination table after aggregating these rows.
CREATE TABLE default.kafka_queue
(
    `_topic` LowCardinality(String), -- _topic, _partition & _timestamp are virtual columns in Kafka table engine --
    `_partition` UInt64,
    `_timestamp` Nullable(DateTime)
    `event_date` UInt32,
    `event_datetime` DateTime,
    `property_id` UInt32,
    `video_title` String,
    `total_view_count` UInt64
)
ENGINE = Kafka
SETTINGS kafka_broker_list = '<kafka-broker>',
kafka_format = 'Protobuf',
kafka_schema = '<protobuf-format-schema>',
kafka_topic_list = '<kafka-topic>'CREATE MATERIALIZED VIEW default.kafka_consumer_mv TO default.aggregated_stats
(
`event_date` UInt32,
`event_datetime` DateTime,
`property_id` UInt32,
`video_title` String,
`total_view_count` SimpleAggregateFunction(sum, UInt64)
)
AS SELECT
event_date,
event_datetime,
property_id,
video_title,
sumSimpleState(total_view_count) AS total_view_count,
FROM default.kafka_queue
GROUP BY
event_date,
event_datetime,
property_id,
video_title,CREATE TABLE default.aggregated_stats
(
`event_date` Date CODEC(DoubleDelta, ZSTD(1)),
`event_datetime` DateTime CODEC(DoubleDelta, ZSTD(1)),
`property_id` UInt32 CODEC(DoubleDelta, ZSTD(1)),
`video_title` String CODEC(ZSTD(1)),
`total_view_count` SimpleAggregateFunction(sum, UInt64) CODEC(ZSTD(1)),
)
ENGINE = ReplicatedAggregatingMergeTree('/clickhouse/ch-{cluster}/tables/{shard}/default/aggregated_stats', '{replica}')
PARTITION BY toStartOfInterval(event_datetime, toIntervalHour(1))
PRIMARY KEY (property_id, event_datetime)
ORDER BY (property_id, event_datetime, video_title, video_id)
TTL event_datetime + toIntervalDay(1)Astute readers will notice that the destination aggregated_stats table is replicated. Since we use a sharded, replicated ClickHouse cluster, the above schema was set up on every server in the cluster. This means that every ClickHouse server consumes from the Kafka topic. The number of Kafka consumers per server is configurable.
We measured how many rows per second we could ingest with this setup by monitoring ClickHouse’s system.events table and were satisfied with the system’s performance in that regard.
SELECT *
FROM system.events
WHERE name LIKE '%InsertedRows%'

Query id: 6c910b60-5ac1-4374-8586-f89d11b43ea7

   ┌─event────────┬─────value─┬─description────────────────────────────┐
1. │ InsertedRows │ 999815268 │ Number of rows INSERTed to all tables. │
   └──────────────┴───────────┴────────────────────────────────────────┘
At the time, we weren’t closely tracking latency—the time it took for data to be ingested and become available for queries from our Monitoring product. This was partially because this was not an out of the box metric available in ClickHouse.
The Problem with Only Measuring Throughput
As query load grew, we noticed that our real-time application began falling behind. Data that should have been processed in near-real-time was delayed, causing visible lag in our customers’ monitoring dashboards. Our system was designed to handle a maximum delay of 20 seconds from the time an event is collected to when it is visible in the metrics on the dashboard. Under increased query load, the delay began to creep up beyond that limit. Initially, we struggled to understand why this was happening. We had plenty of throughput, after all—our system was demonstrably able to ingest millions of rows per second and had plenty of available CPU. So what gives?
After further investigation, we realized that our ingestion process was introducing significant latency—upwards of 12 seconds in some cases—into our entire pipeline. This meant that, even though we were meeting our throughput targets, the system was failing to meet the real-time requirements of our application when query load and traffic increased demands on the system. The delay was in fact the result of how long it was taking for the data to move from Kafka into ClickHouse and become queryable. Additionally, any service processing this data upstream of ClickHouse had narrowing margins with which to complete its tasks because so much of the 20s window we have was eaten up by ClickHouse ingestion.
How did we discover this?
Monitoring Latency
Initially, we were using Burrow to track Kafka consumer latency. Burrow provides information about consumer lag by periodically scraping Kafka consumer group offsets. Unfortunately, this proved to be quite unreliable. While we could see how many records behind the latest message the ClickHouse Kafka consumers were reading, it wasn’t clear how that translated into seconds, making it difficult to directly connect consumer lag to the real-time performance of our system.
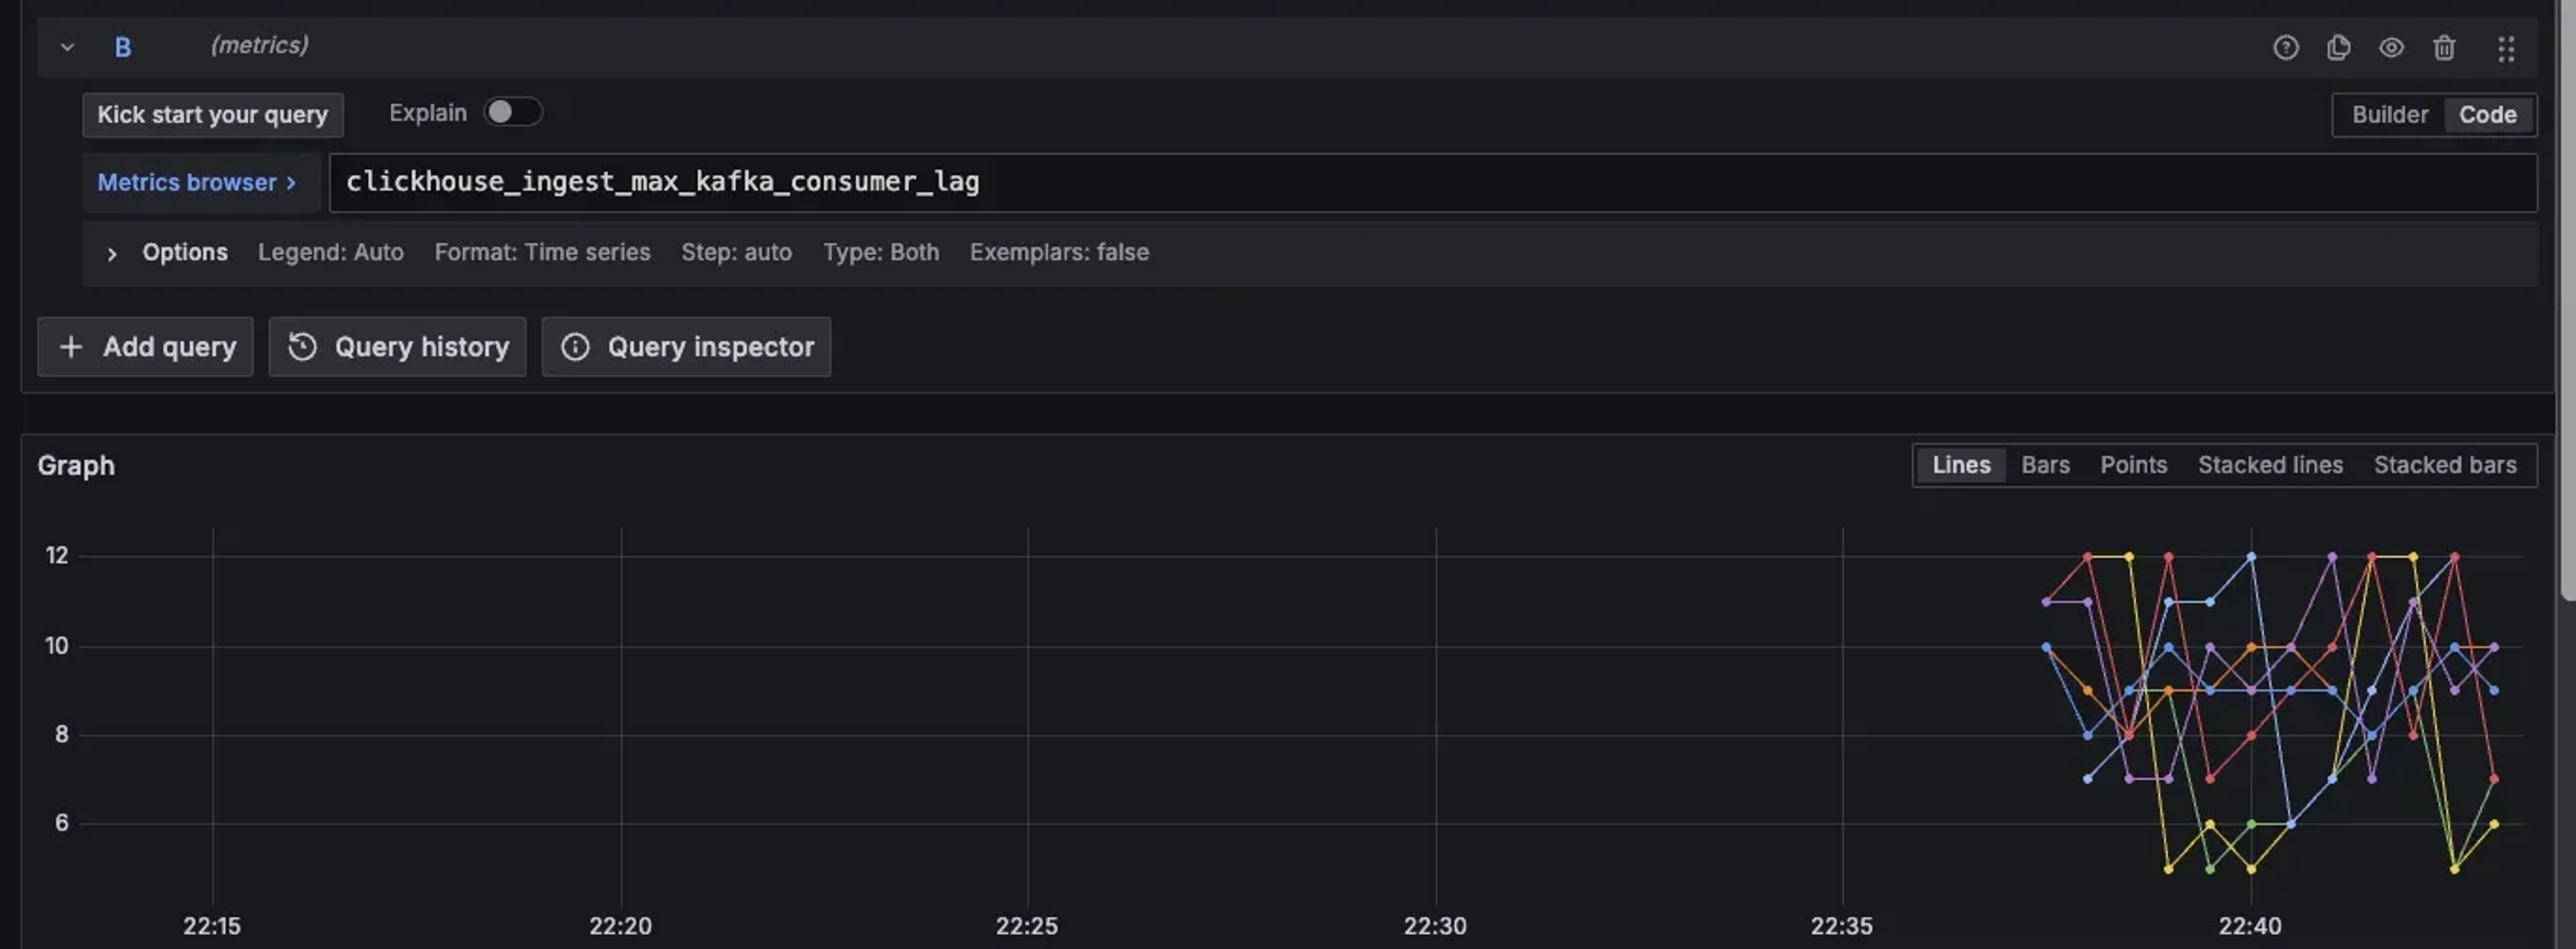
To get a clearer picture, we added a materialized view in ClickHouse that measured ingestion latency directly within the database itself. This view allowed us to track the time between when a message was produced to Kafka and when it was ingested into ClickHouse by Kafka Table Engine - giving us a concrete measure of the seconds of delay introduced by the ingestion process.
CREATE TABLE default.kafka_ingest_metrics_disk
(
    `_topic` LowCardinality(String),
    `_partition` UInt64,
    `kafka_timestamp_bucket` DateTime,
    `latest_kafka_timestamp` SimpleAggregateFunction(max, DateTime),
    `max_kafka_consumer_lag` SimpleAggregateFunction(max, UInt64)
)
ENGINE = AggregatingMergeTree
ORDER BY (_topic, _partition, kafka_timestamp_bucket)
TTL kafka_timestamp_bucket + toIntervalHour(1)
SETTINGS index_granularity = 8192 │CREATE MATERIALIZED VIEW default.kafka_ingest_metrics_kte_stats_0_queue_mv TO default.kafka_ingest_metrics_disk
(
`_topic` LowCardinality(String),
`_partition` UInt64,
`kafka_timestamp_bucket` DateTime,
`latest_kafka_timestamp` Nullable(DateTime),
`max_kafka_consumer_lag` Nullable(Int64)
)
AS SELECT
_topic,
_partition,
toStartOfInterval(now(), toIntervalSecond(15)) AS kafka_timestamp_bucket,
max(_timestamp) AS latest_kafka_timestamp,
max(dateDiff('second', _timestamp, now())) AS max_kafka_consumer_lag
FROM default.kafka_queue
WHERE _timestamp IS NOT NULL
GROUP BY
_topic,
_partition,
kafka_timestamp_bucket │This works because Kafka Table Engine exposes a number of virtual columns. One of these is _timestamp which (unless your Kafka producers override this field specifically), is the timestamp of the message when it was written to Kafka. The materialized view is triggered on insert to the kafka_queue table. So it can take the difference between this timestamp and the current time to measure how many seconds after the message was written to Kafka it was consumed by ClickHouse.
Finally, to expose this metric to prometheus, we added the following HTTP handler to ClickHouse. Altinity has a great blog post on building Prometheus endpoints in ClickHouse for further details on this method.
WITH added_row_number AS
    (
        SELECT
            'clickhouse_ingest_max_kafka_consumer_lag' AS name,
            'Max Kafka Table Engine consumer lag for each topic and partition consumed, in seconds' AS help,
            'gauge' AS type,
            CAST(max_kafka_consumer_lag, 'Float64') AS value,
            toUnixTimestamp64Milli(toDateTime64(kafka_timestamp_bucket, 3)) AS timestamp,
            map('topic', toString(_topic), 'partition', toString(_partition)) AS labels,
            ROW_NUMBER() OVER (PARTITION BY _topic, _partition ORDER BY kafka_timestamp_bucket DESC) AS row_number
        FROM kafka_ingest_metrics_disk
    )
    SELECT name, value, timestamp, labels, help, type
    FROM added_row_number
    WHERE row_number = 1
    ORDER BY name DESC
)
FORMAT Prometheus
This new consumer lag metric illuminated the issue: the ingest process itself was causing our real-time application to fall behind! Once we could see the delay directly, we realized that optimizing only for throughput had come at the cost of latency—an imbalance that we needed to correct.
Early Hypothesis and Dead Ends
The first thing we tried was to reduce the kafka_flush_interval_ms on our Kafka Table Engine from 7500 milliseconds down to 2200 milliseconds. However, this tanked our throughput to <500k rows per second per server - the classic latency vs throughput tradeoff. ClickHouse was now writing more frequently to disk, but was not able to write as many rows per second as a result. We knew we needed to find a way to keep the flush interval near 2s (since our goal was to keep ingestion latency at < 5s total) but not the expense of throughput. So, we searched for the bottleneck.
Hypothesis 1: Network Bottlenecks
One of the first things we looked at was the possibility of network bottlenecks between Kafka and ClickHouse. Our reasoning was that the cluster might be constrained by bandwidth, especially since we were seeing some dropped and queued packets in our Kafka metrics.
Experiment: We used iperf to measure network throughput between our ClickHouse nodes and the Kafka brokers. Additionally, we moved the Kafka brokers to instances with increased bandwidth and monitored the impact on performance.
Result: The network was not the limiting factor. The iperf tests showed that bandwidth was well within the limits required for our traffic, and upgrading the Kafka instances had no significant impact on ingest performance. This ruled out the network as the root cause.
Hypothesis 2: Disk Throughput
Next, we considered whether disk I/O on the Kafka nodes was causing the bottleneck. Given that ClickHouse was ingesting large volumes of data, disk contention seemed like a potential issue.
Experiment: While monitoring disk throughput using both our node exporter and AWS console metrics, we added additional ClickHouse replicas to read from our Kafka cluster
Result: Having two ClickHouse replicas reading from the same Kafka topic doubled throughput from Kafka- eliminating Kafka disks, and indeed Kafka itself, as the bottleneck.
Hypothesis 3: ClickHouse Format or Engine Bottlenecks
Since Kafka and the network were eliminated, we knew the bottleneck must be within ClickHouse. There were two potential areas we could think of - either the destination table engine or the data format of the ingested rows.
Experiment: We measured throughput for different table engines (Null, MergeTree, AggregatingMergeTree) and formats (RAW_BLOB, ProtobufSingle, CapNProtoSingle)
Result:
Surprisingly, whether the destination table aggregated the data or not made almost no difference. This indicated that it was the data format which was the problem. If ClickHouse doesn’t have to parse the data (the RAW_BLOB format), it can ingest 8M rows/s with Kafka Table Engine. As soon as it needed to parse the data, there was a steep drop in throughput. It was over 8x slower to insert protobuf records than raw binary blobs!
Engine | |||
|---|---|---|---|
Format | NULL | MergeTree | AggregatingMergeTree |
RAW_BLOB | 8 mil/s | 2.5 mil/s | |
CapNProto Single | 2.2 mil/s | 1.0 mil/s | 800 k/s |
ProtoBuf Single | 930 k/s | 500 k/s | 450 k/s |
Protobuf Single Format Parsing
We turned our focus to the Kafka Table Engine’s handling of the protobuf single format. We suspected that the inefficiency in parsing individual messages might be slowing down ingestion, especially under heavy loads.
The Setup
To test this theory, we focused on two key changes:
- Batch Size and Format: We switched from the protobuf single format to a batched format, initially setting the batch size to 500 rows per Kafka message and later increasing it to 1000 rows. We hoped this change would reduce the overhead caused by parsing individual messages.
- Flush Interval: We experimented with the kafka_flush_interval_ms setting, which controls how frequently data is flushed from Kafka to ClickHouse. We reduced the flush interval from the initial 7500 milliseconds down to 2200 milliseconds.
Results
These changes led to several notable improvements:
- Throughput: With the batched format and larger batch size, we saw sustained throughput of around 2 million rows per second, with occasional spikes up to 4 million rows per second by a single ClickHouse server during peak loads.
- Latency: The combined effect of the batched format and reduced flush interval lowered ingest latency from 12 seconds to a more acceptable range of 2 to 6 seconds, meeting our real-time processing goals.
- CPU Utilization: While CPU usage did increase slightly—from around 25% to 31%—the improvements in throughput and latency made this trade-off worthwhile.
Why These Changes Worked
An underlying bug in ClickHouse’s handling of the protobuf single format meant that the system was spending too much time parsing individual messages. By switching to a batched format with multiple rows in a single Kafka message, we significantly reduced this overhead. The 2200 ms flush interval also played a crucial role in maintaining this latency by preventing large batches of data from accumulating before being flushed to disk.
Together, these changes resolved the latency issue while maintaining high throughput at a manageable CPU utilization.
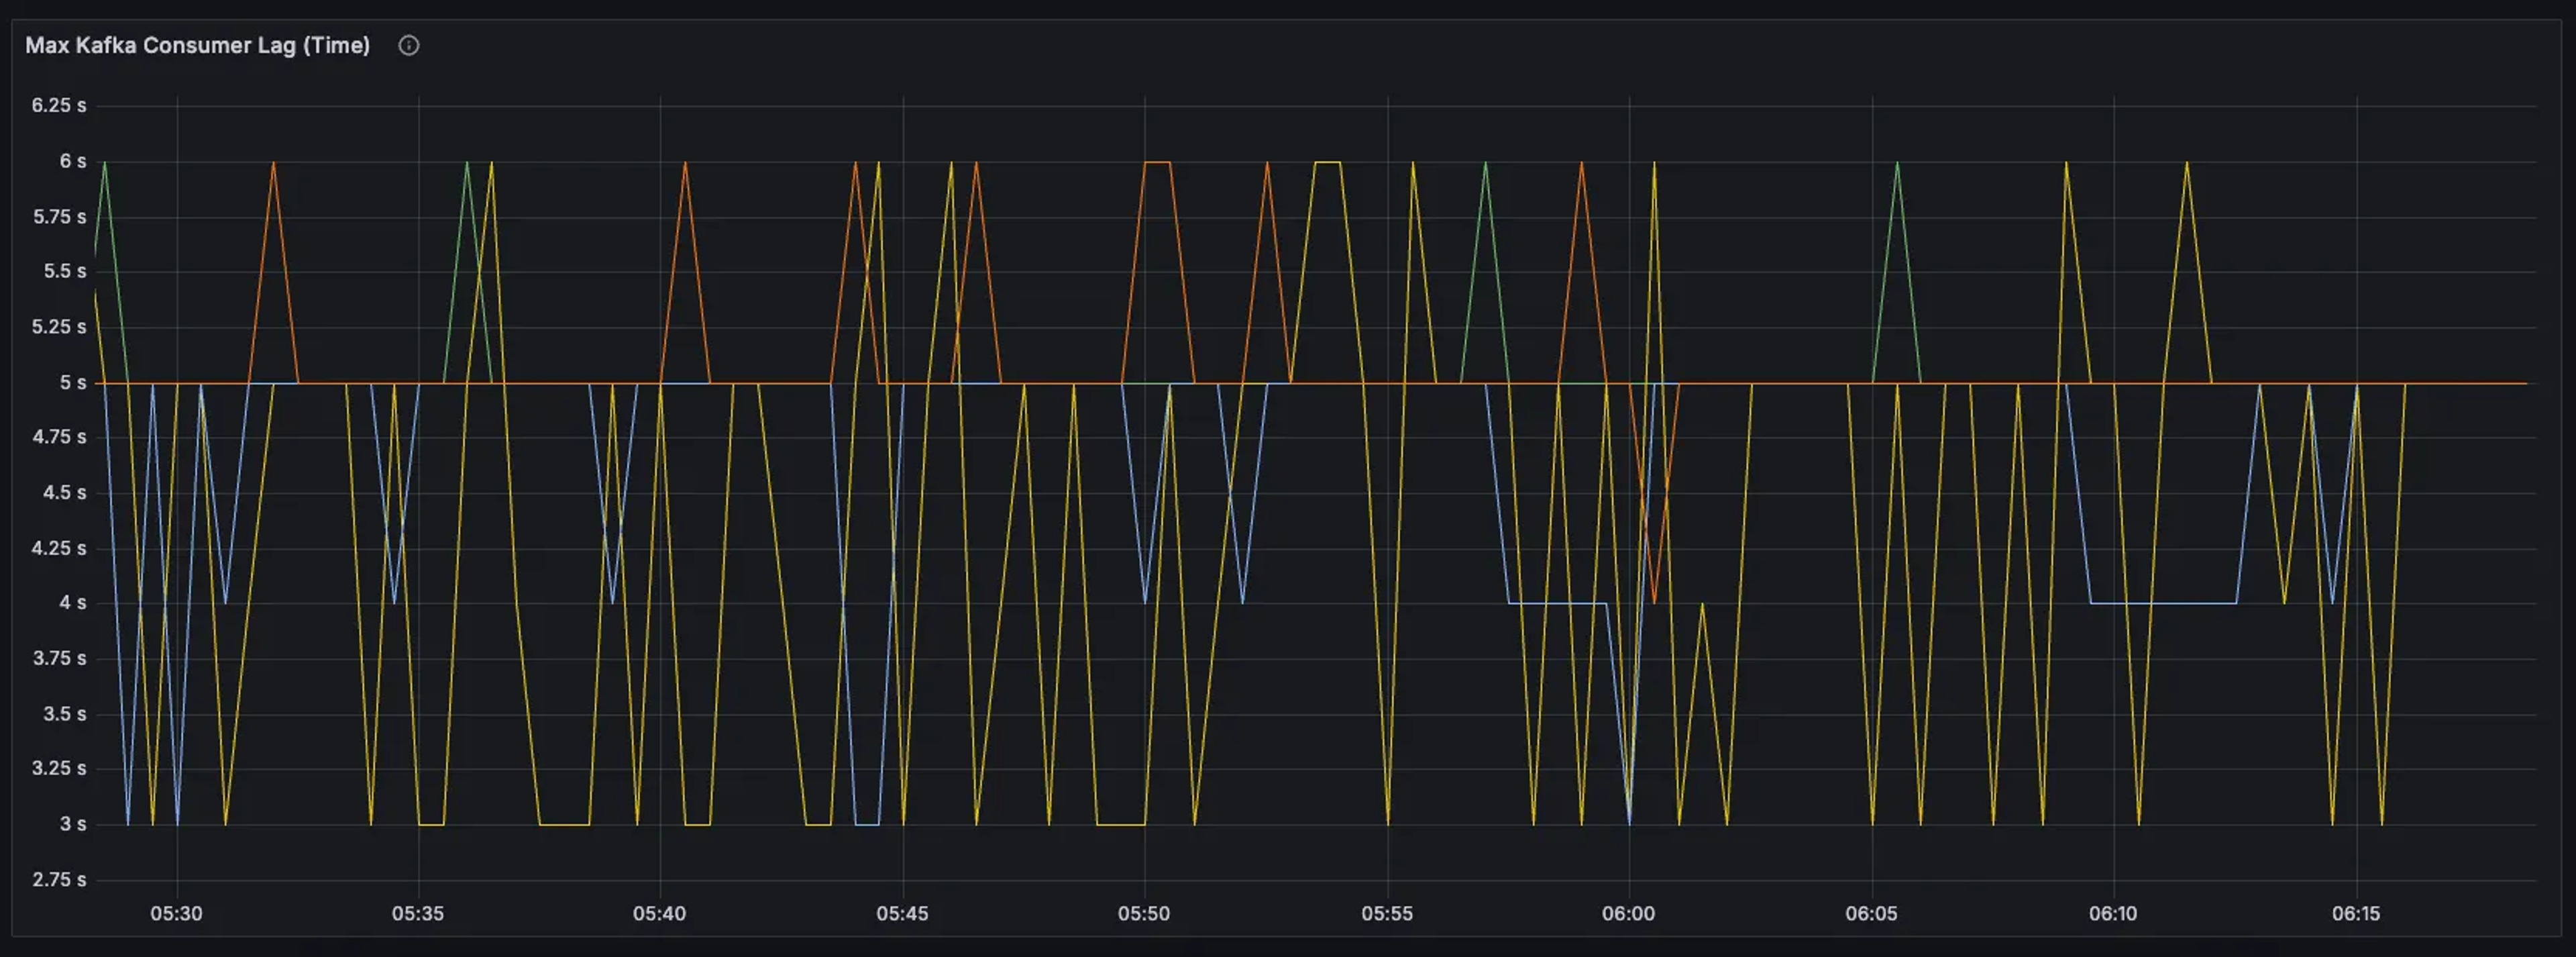
One of the key lessons we learned was that throughput and latency are almost always in trade-off. Focusing exclusively on throughput at the expense of latency led to a system that could handle large volumes of data but not in real-time. While this seems obvious in hindsight, the lack of robust monitoring for either one of these key metrics can lead to a major blind spot. Anyone using ClickHouse’s Kafka Table Engine should at minimum monitor both inserted rows / second and latency, which can be done using a materialized view as described here.

