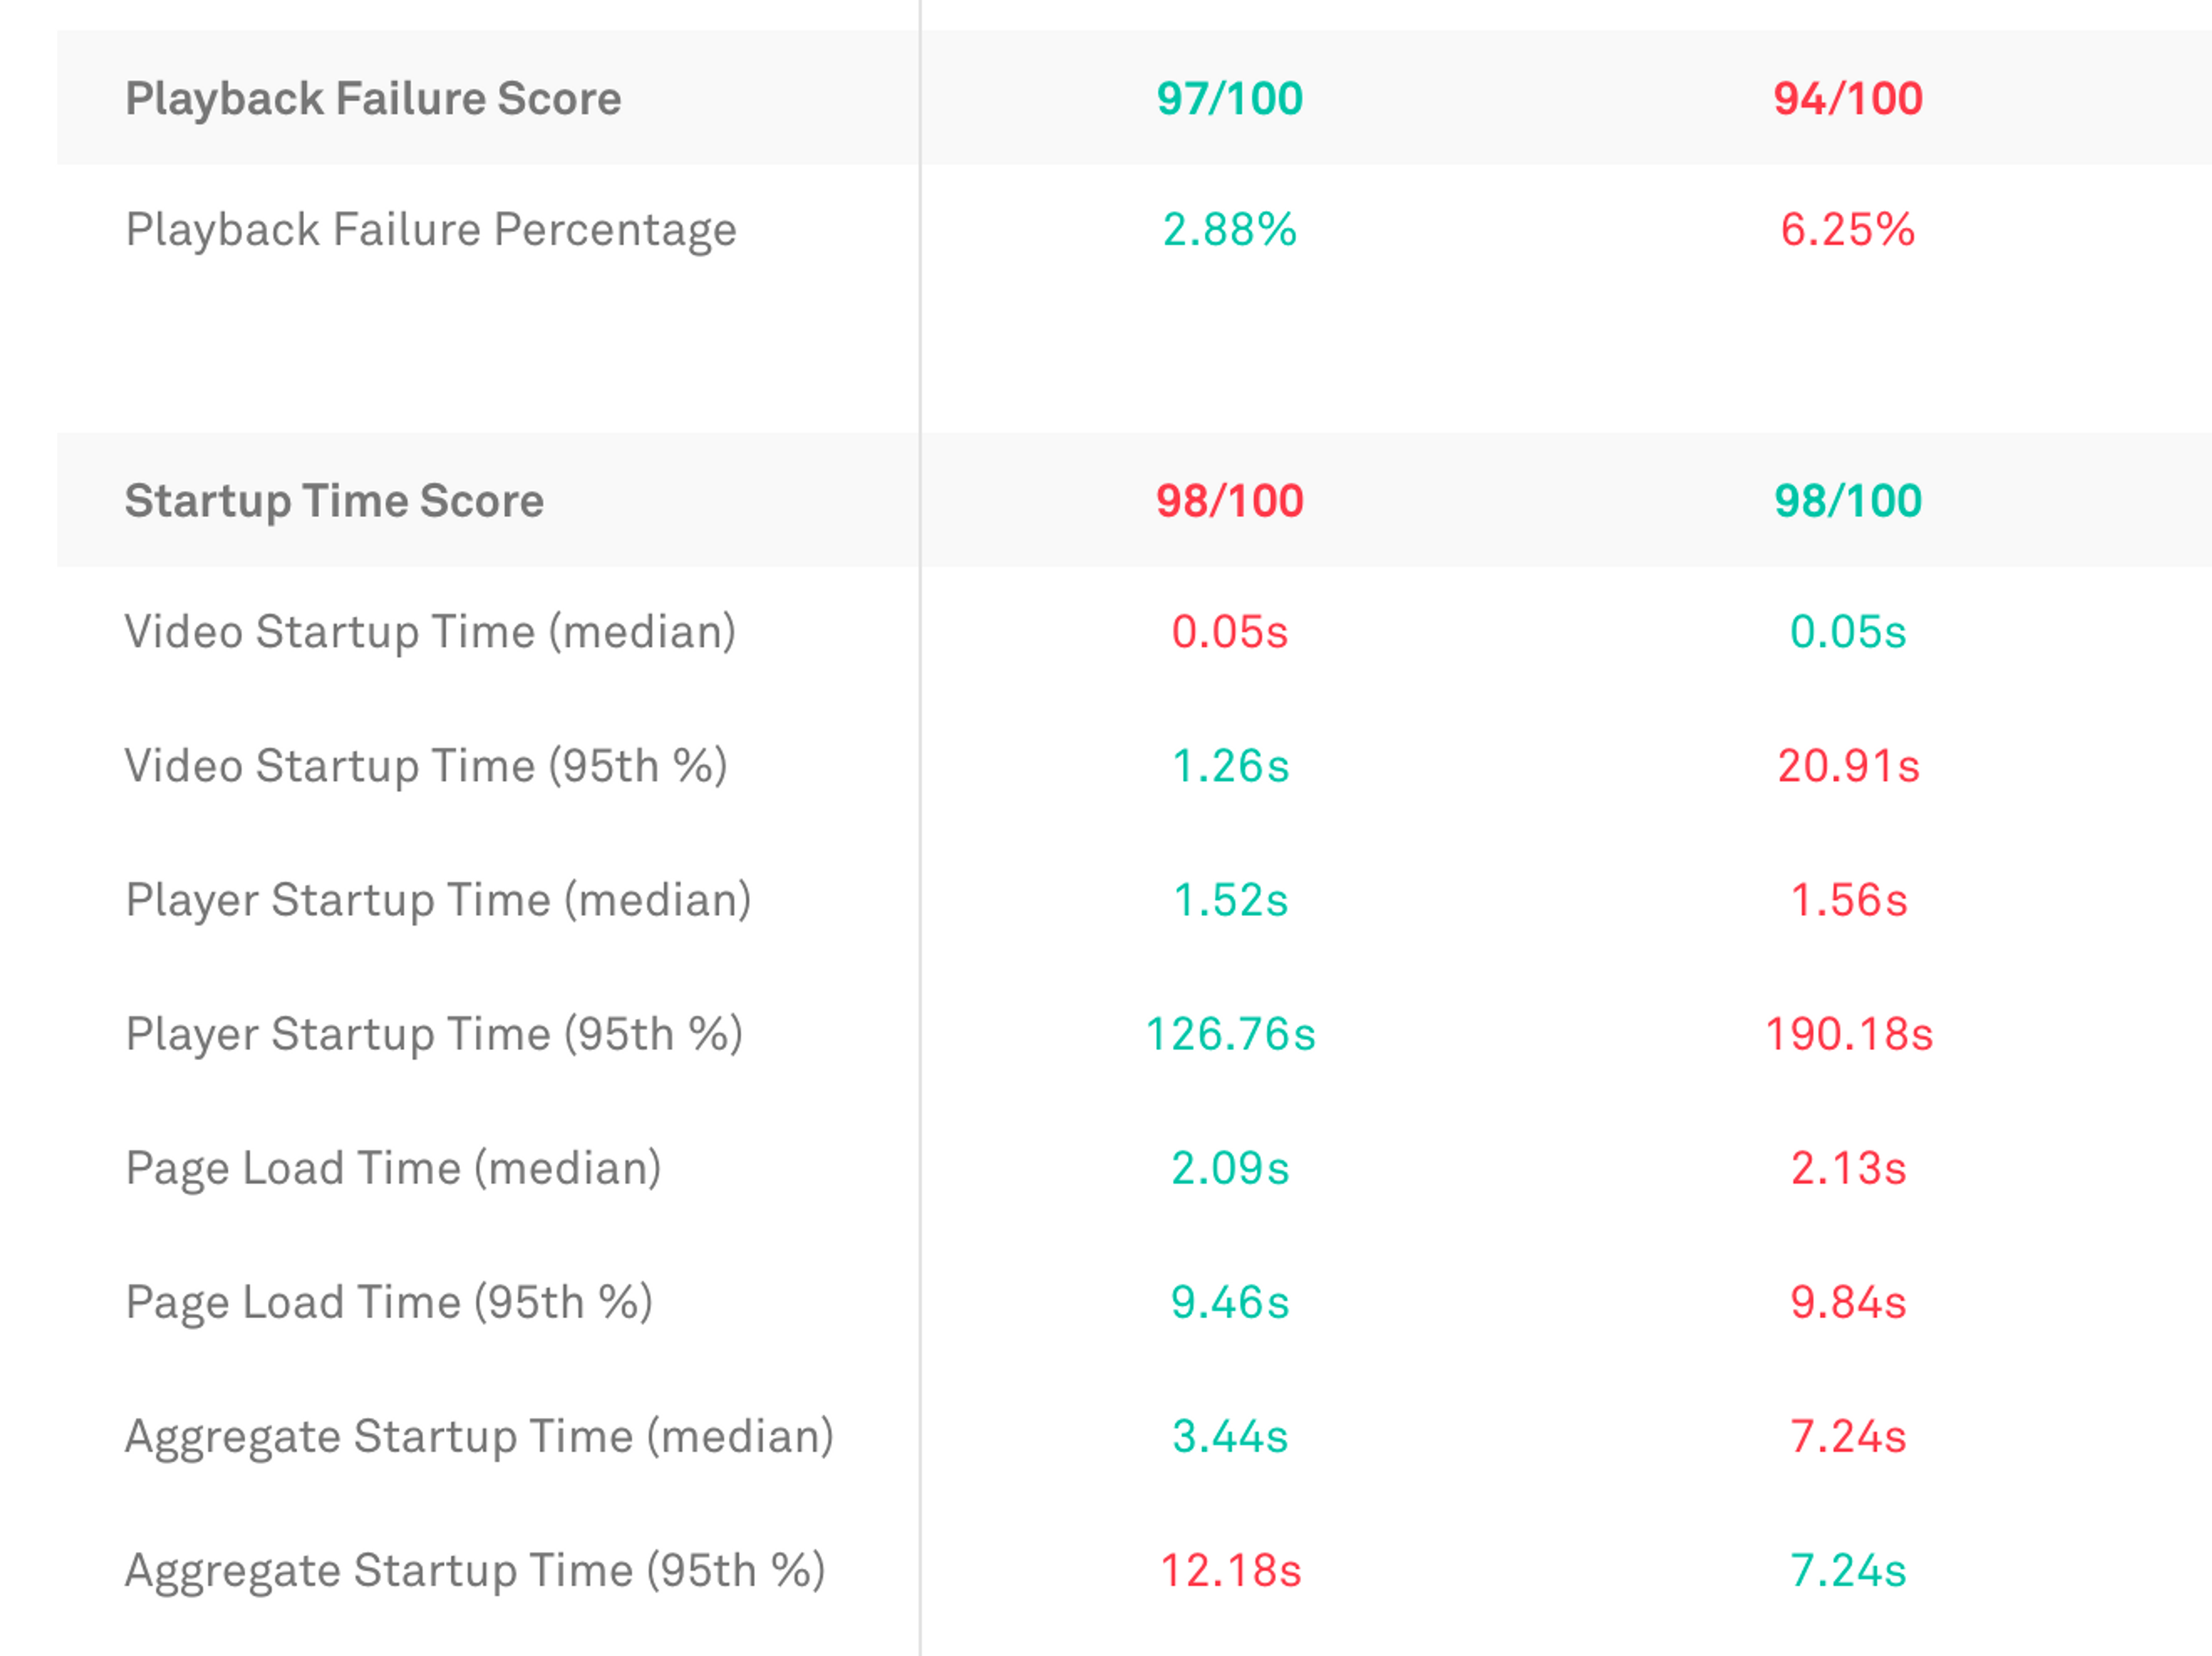
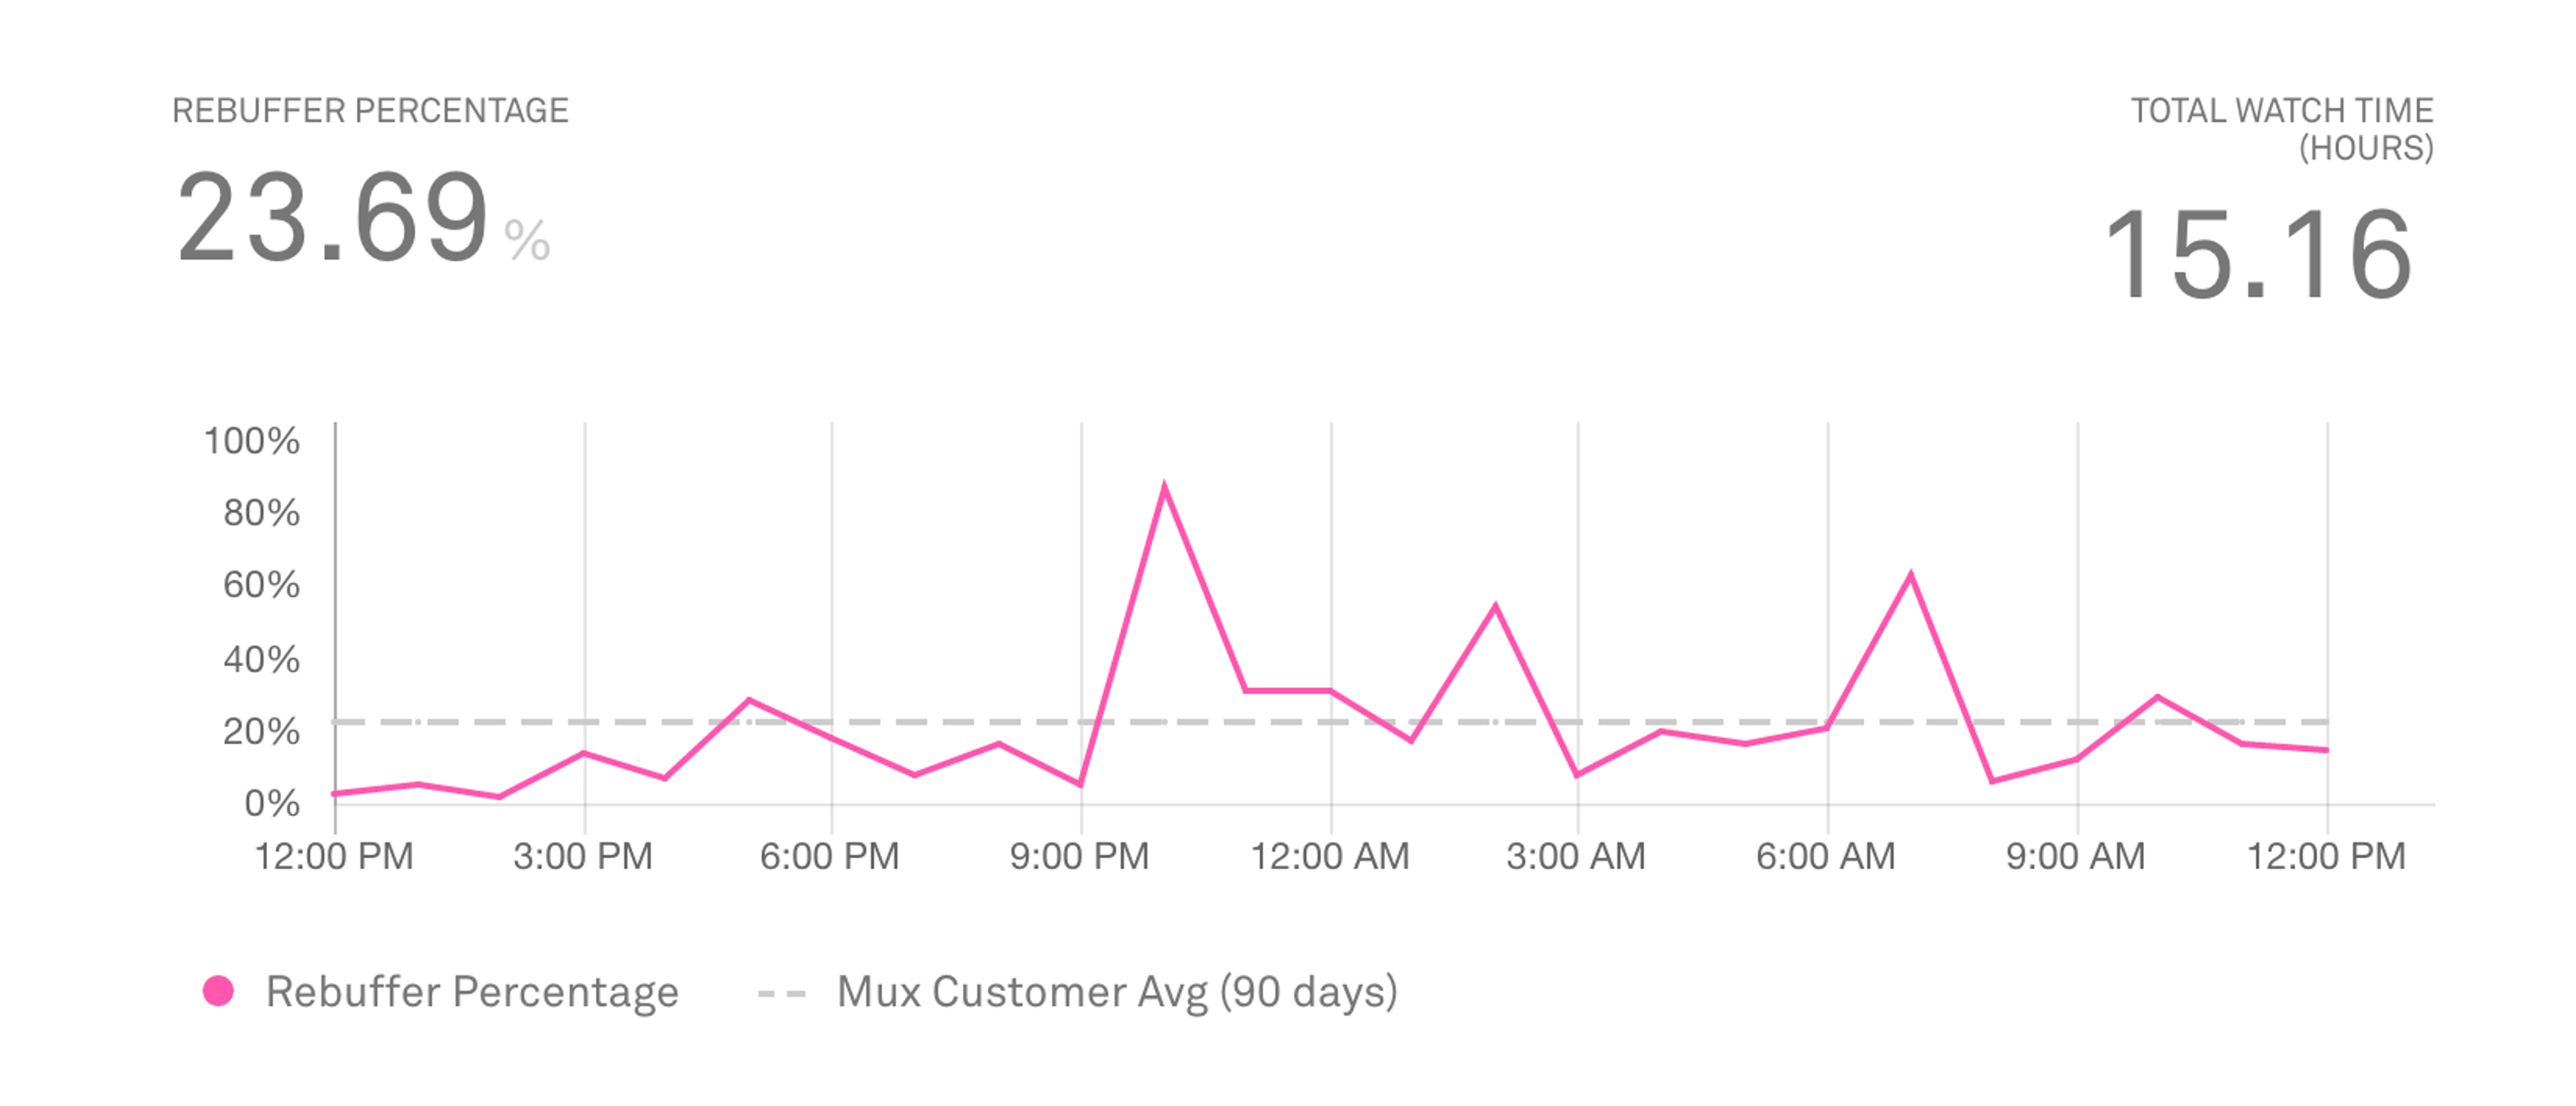
We've shipped two new features at Mux over the last two weeks. The first is a tool to compare all metrics across two or more specific values. The second is a global benchmark that gives customers an idea of how their performance compares to the overall market.
Metric Comparison
A common use for a performance analytics product like Mux is comparing two (or more) slices of traffic. For example, if you're evaluating two CDNs, or rolling out an upgrade to your video player, you might want to see the holistic performance of these CDNs or players side-by-side.
We took inspiration from a familiar tool in e-commerce: product comparison grids. These tools let a user select a few values to compare (e.g. 13" Macbook Pro vs. 15" Macbook Pro) and see a quick summary of the differences. Similarly, our metric comparison tool lets users select a few values - like traffic delivered by Akamai vs. Fastly - and see performance across all of our metrics side-by-side.

Global Scores
While it's helpful for a publisher to understand their overall video streaming performance, sometimes you want to grade on a curve. If you're seeing a 11% rebuffering percentage, it's useful to know how 11% compares to other publishers. That's where global scores come in.

For now, we've added a "Mux Customer Average" baseline that appears on metrics charts. Over time, we have more plans for this functionality, and we think there is a lot of interesting insight that publishers can get from this global data.
If you're interested in seeing this data, get in touch and we'll help you get started.


