When Mux adds new features to any of its products, we try hard to make sure that the feature is easy to use and valuable by default. This led us to develop our existing anomaly-detection-based alerting feature. Without any configuration it automatically analyzes video sessions for failures as they happen and notifies you so your team can quickly fix the problem.
This alerting functionality was easy for video platform teams to use but we know some of our customers also need more control over the metrics and conditions that are used for alerts. For example, you may have SLAs your organization has agreed to meet or the operations team might have quarterly improvement OKRs they are trying to achieve. That’s why we created a new alerting product that pairs our real-time data with flexible alerting conditions to make it easier than ever to operate and monitor your video platform.
Defining your alerts
You are able to define alerts for most of the data available from the Real-Time Dashboard: currently including Playback Failure Percentage, median Video Startup Time, Rebuffering Percentage, and Concurrent Viewers (CCV).
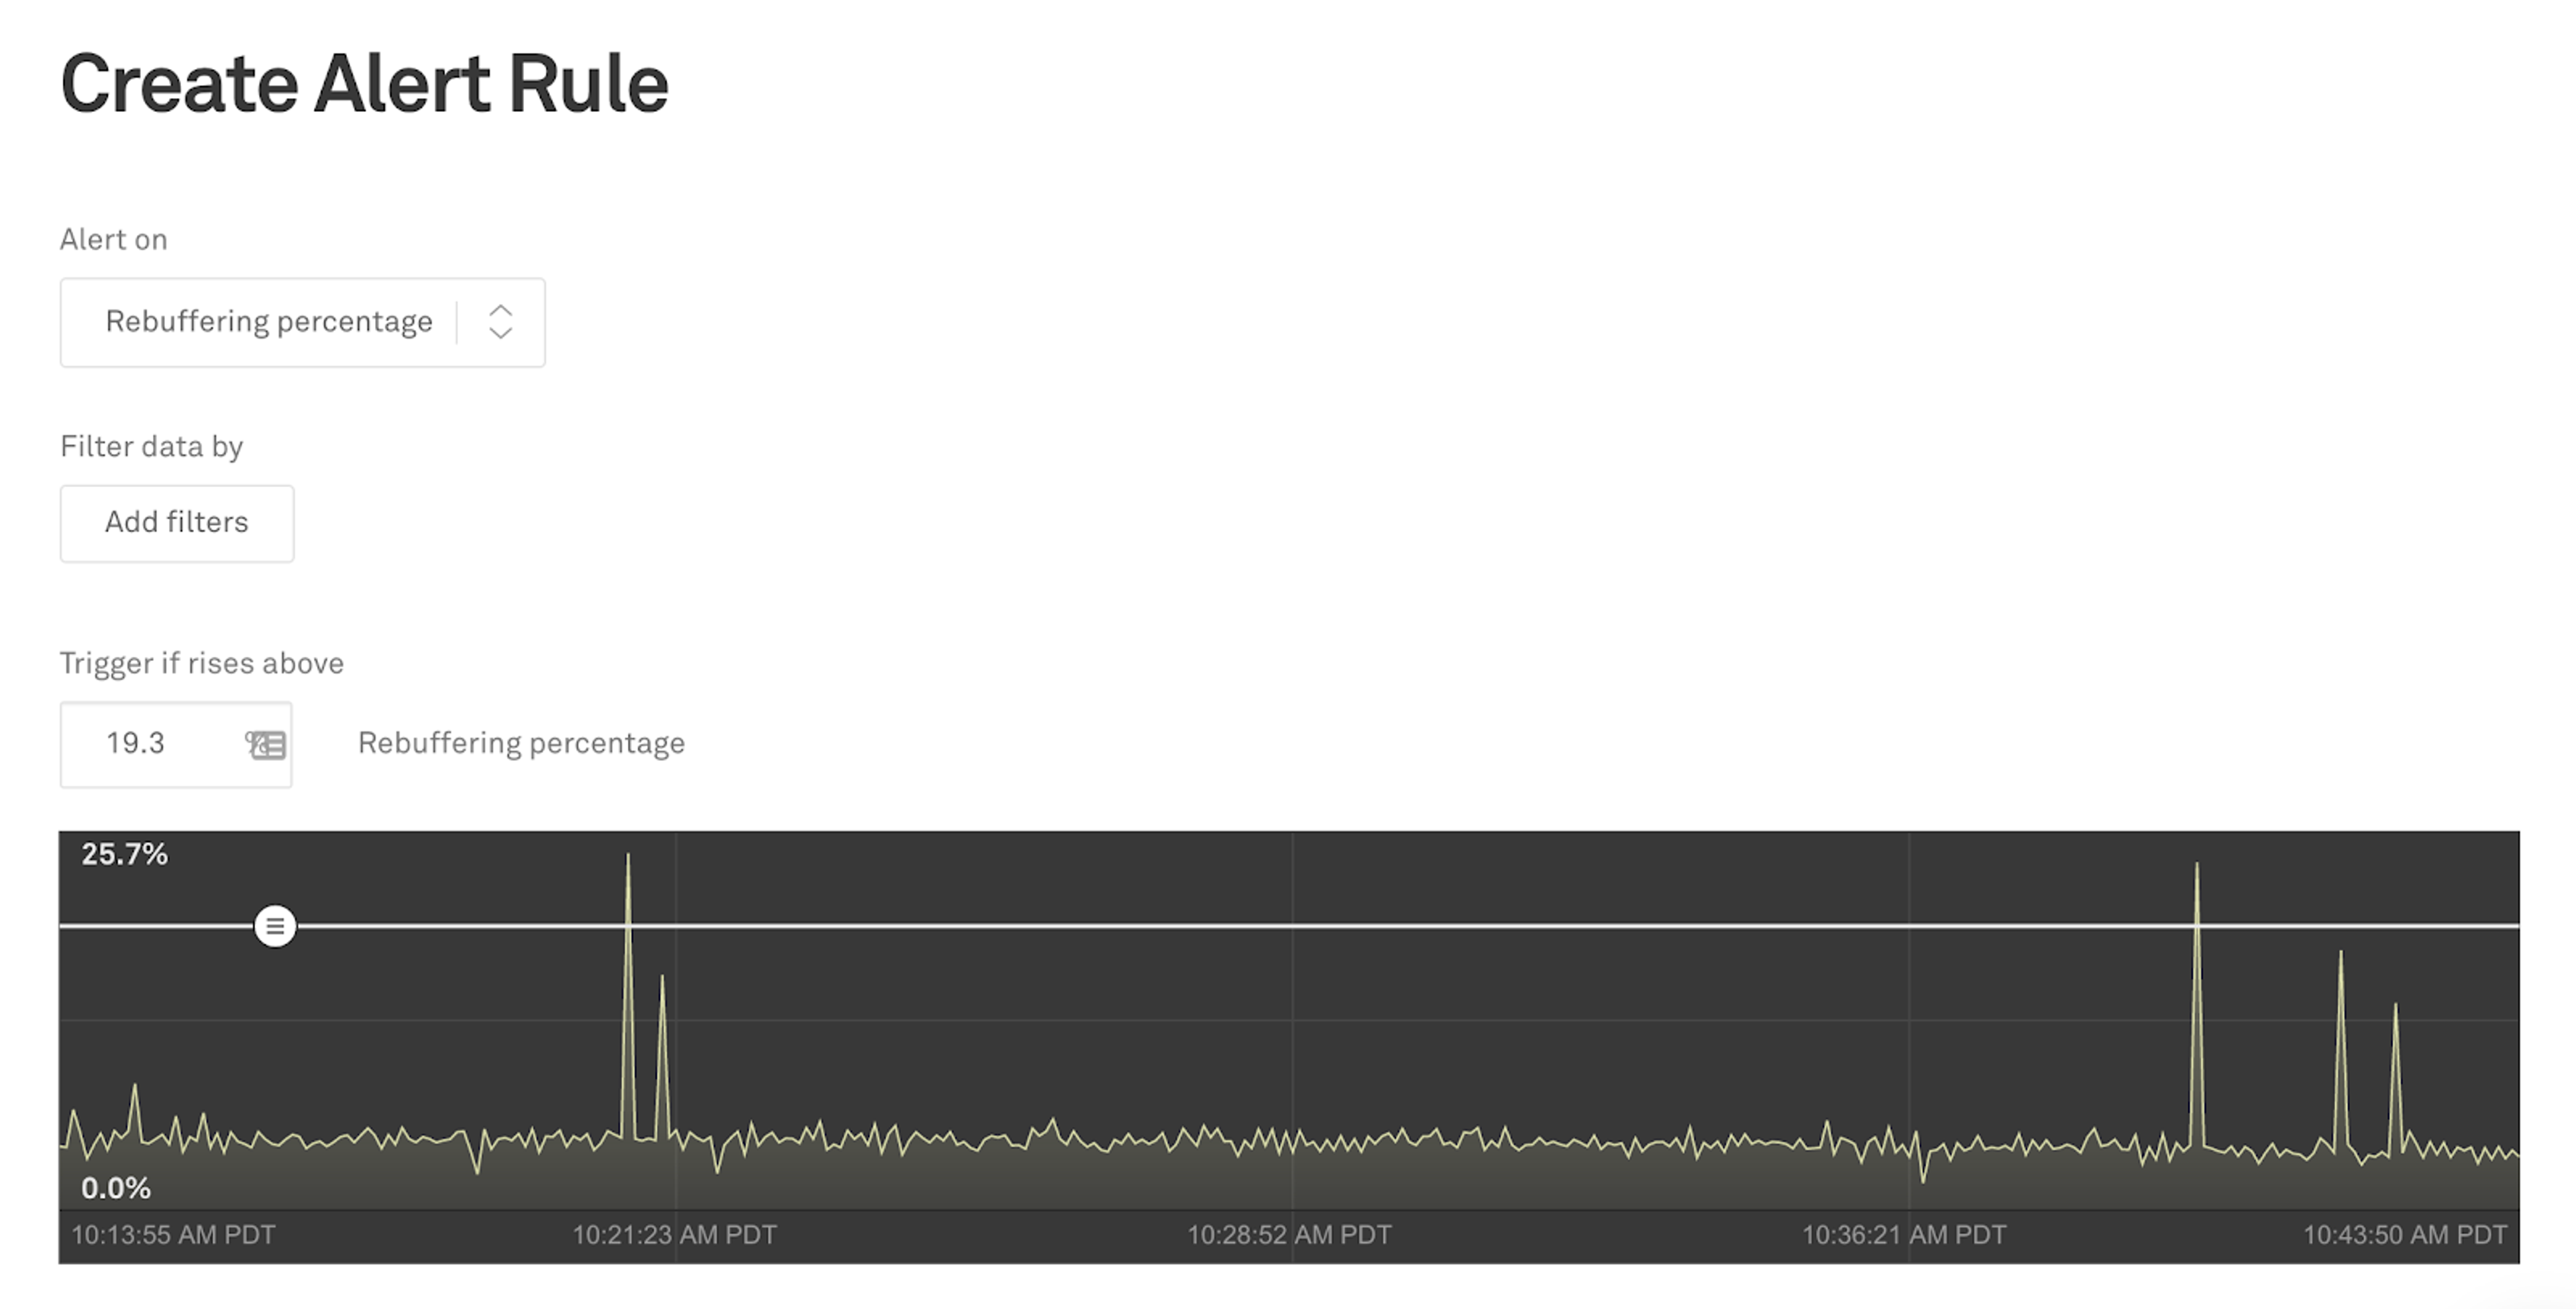
For most metrics, you define an alert to fire when a metric is above a threshold value: say, a rebuffering percentage is above 5%. For concurrent viewers, you can define an alert that is above or below a specified threshold. This allows you to be alerted if the number of concurrent viewers drops to an unhealthy level or if you get a spike of viewers that may cause issues for your video platform.
In general, setting alert thresholds can be a bit tricky. You want to set the rule thresholds at a level that doesn’t miss meaningful customer impacting events but that also doesn’t ping you in the middle of the night because of a small number of bad views.
The chart displays the recent performance of the chosen metric. You can easily set the threshold level by dragging the slider to the desired level or type it in manually.
Filters
Video teams often have specific criteria they want to watch in order to flag issues. The iOS development team may want to be notified of issues with the performance specifically on their player. Or the operations team may want to be alerted if a specific CDN is impacted.
You can set any of the filters, including multiple dimensions and exclusion filters, just like you can on the Real-TIme Dashboard. The alert will only track the data included in the filter and notify you when the performance for that specific filter is above the threshold you set.
Sensitivity
In addition to the metric value you can set the amount of time and audience size required for an alert to fire.
The amount of time the threshold condition must be met for the alert to fire can be set from one minute to one hour. You will want to set this alert interval to be long enough that it doesn’t fire due to a short-term issue that quickly resolves itself. For most normal operating situations a five minute interval (the default) will do well to balance your ability to react and unhelpful noise.
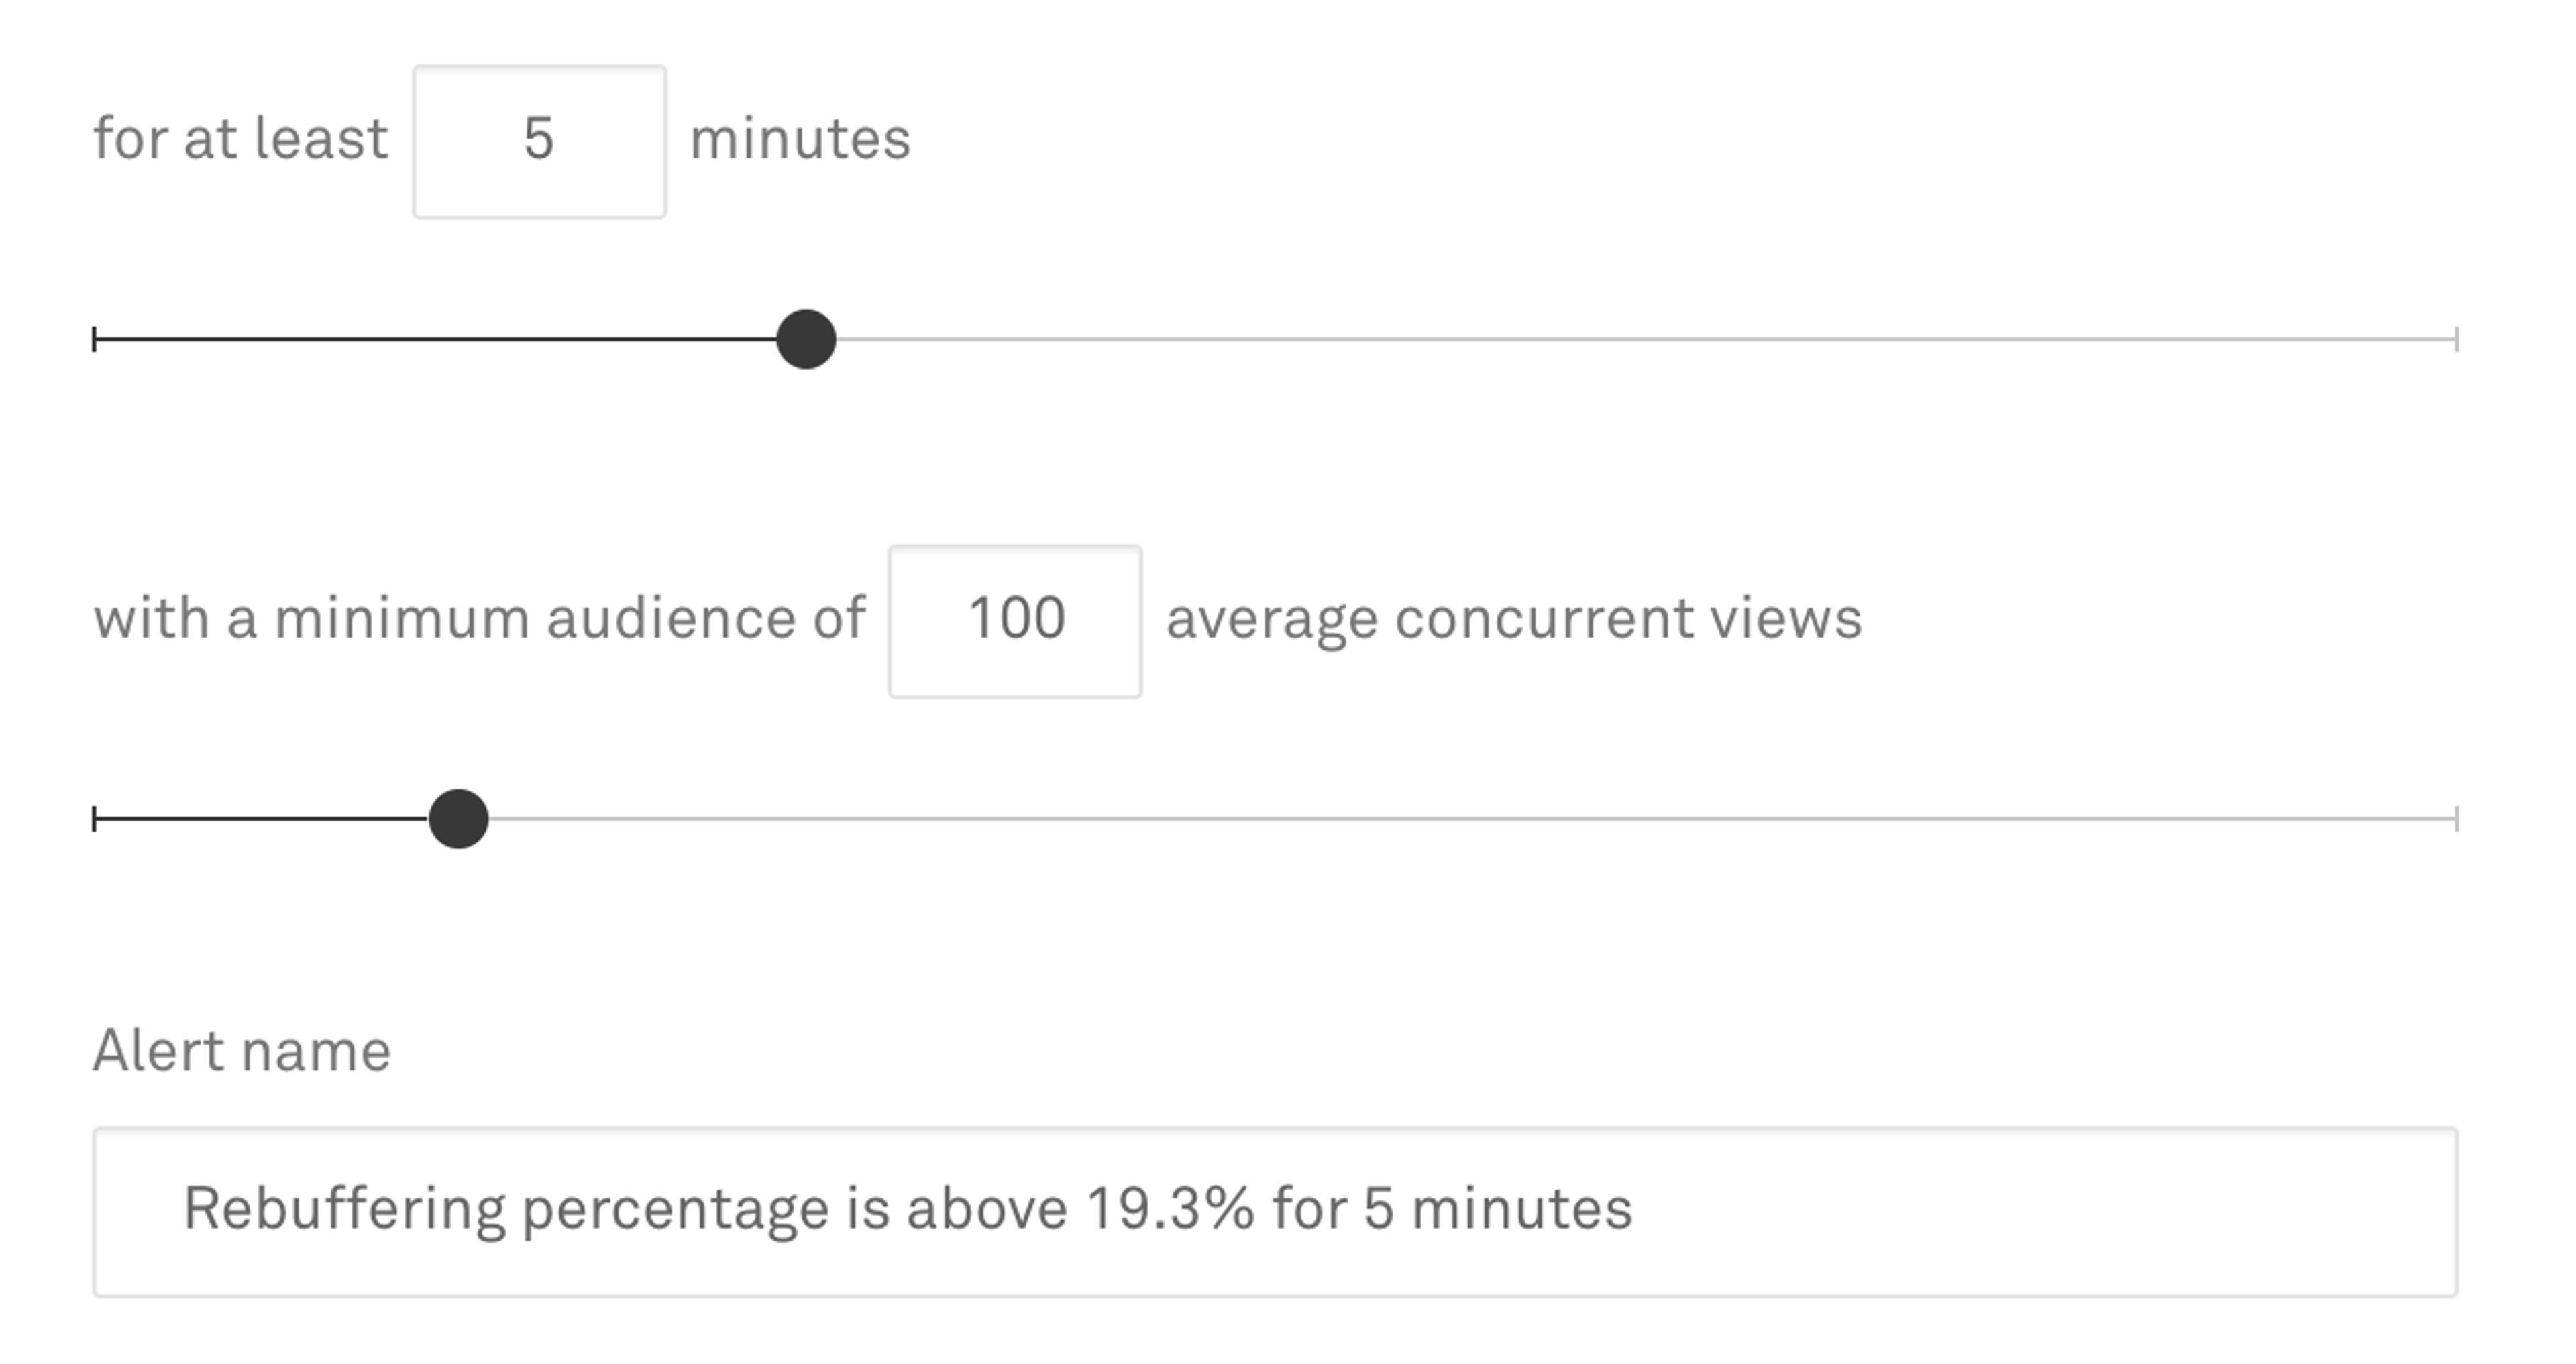
The minimum audience size can be set between 1 and 10,000 concurrent viewers (average over the time window). If the number of viewers drops below the minimum audience size, the alert will not be fired until it is back above the minimum for at least the time defined by the alert interval. The right number is dependent on your audience, but the lower it is the more likely alerts can be fired by outlier viewers. The default of 100 viewers is a decent starting point.
When a problem happens
When a problem happens and an alert fires, you need to make sure you get the notifications so it can be escalated to the proper channels.
Mux Data provides alert incident notifications via email, Slack, as well as PagerDuty. You can also integrate with other services such as OpsGenie via email.
Integrating alert notifications with a tool such as PagerDuty allows you to create specific escalation processes for different types of alerts or based on the data contained in the alert incident.
From the notifications or the incident list in the Dashboard, the alert incident can be opened to view the details. If the incident is on-going, it is easy to open the Real-Time Dashboard directly from the incident detail page to dig more deeply into the cause of the problem.
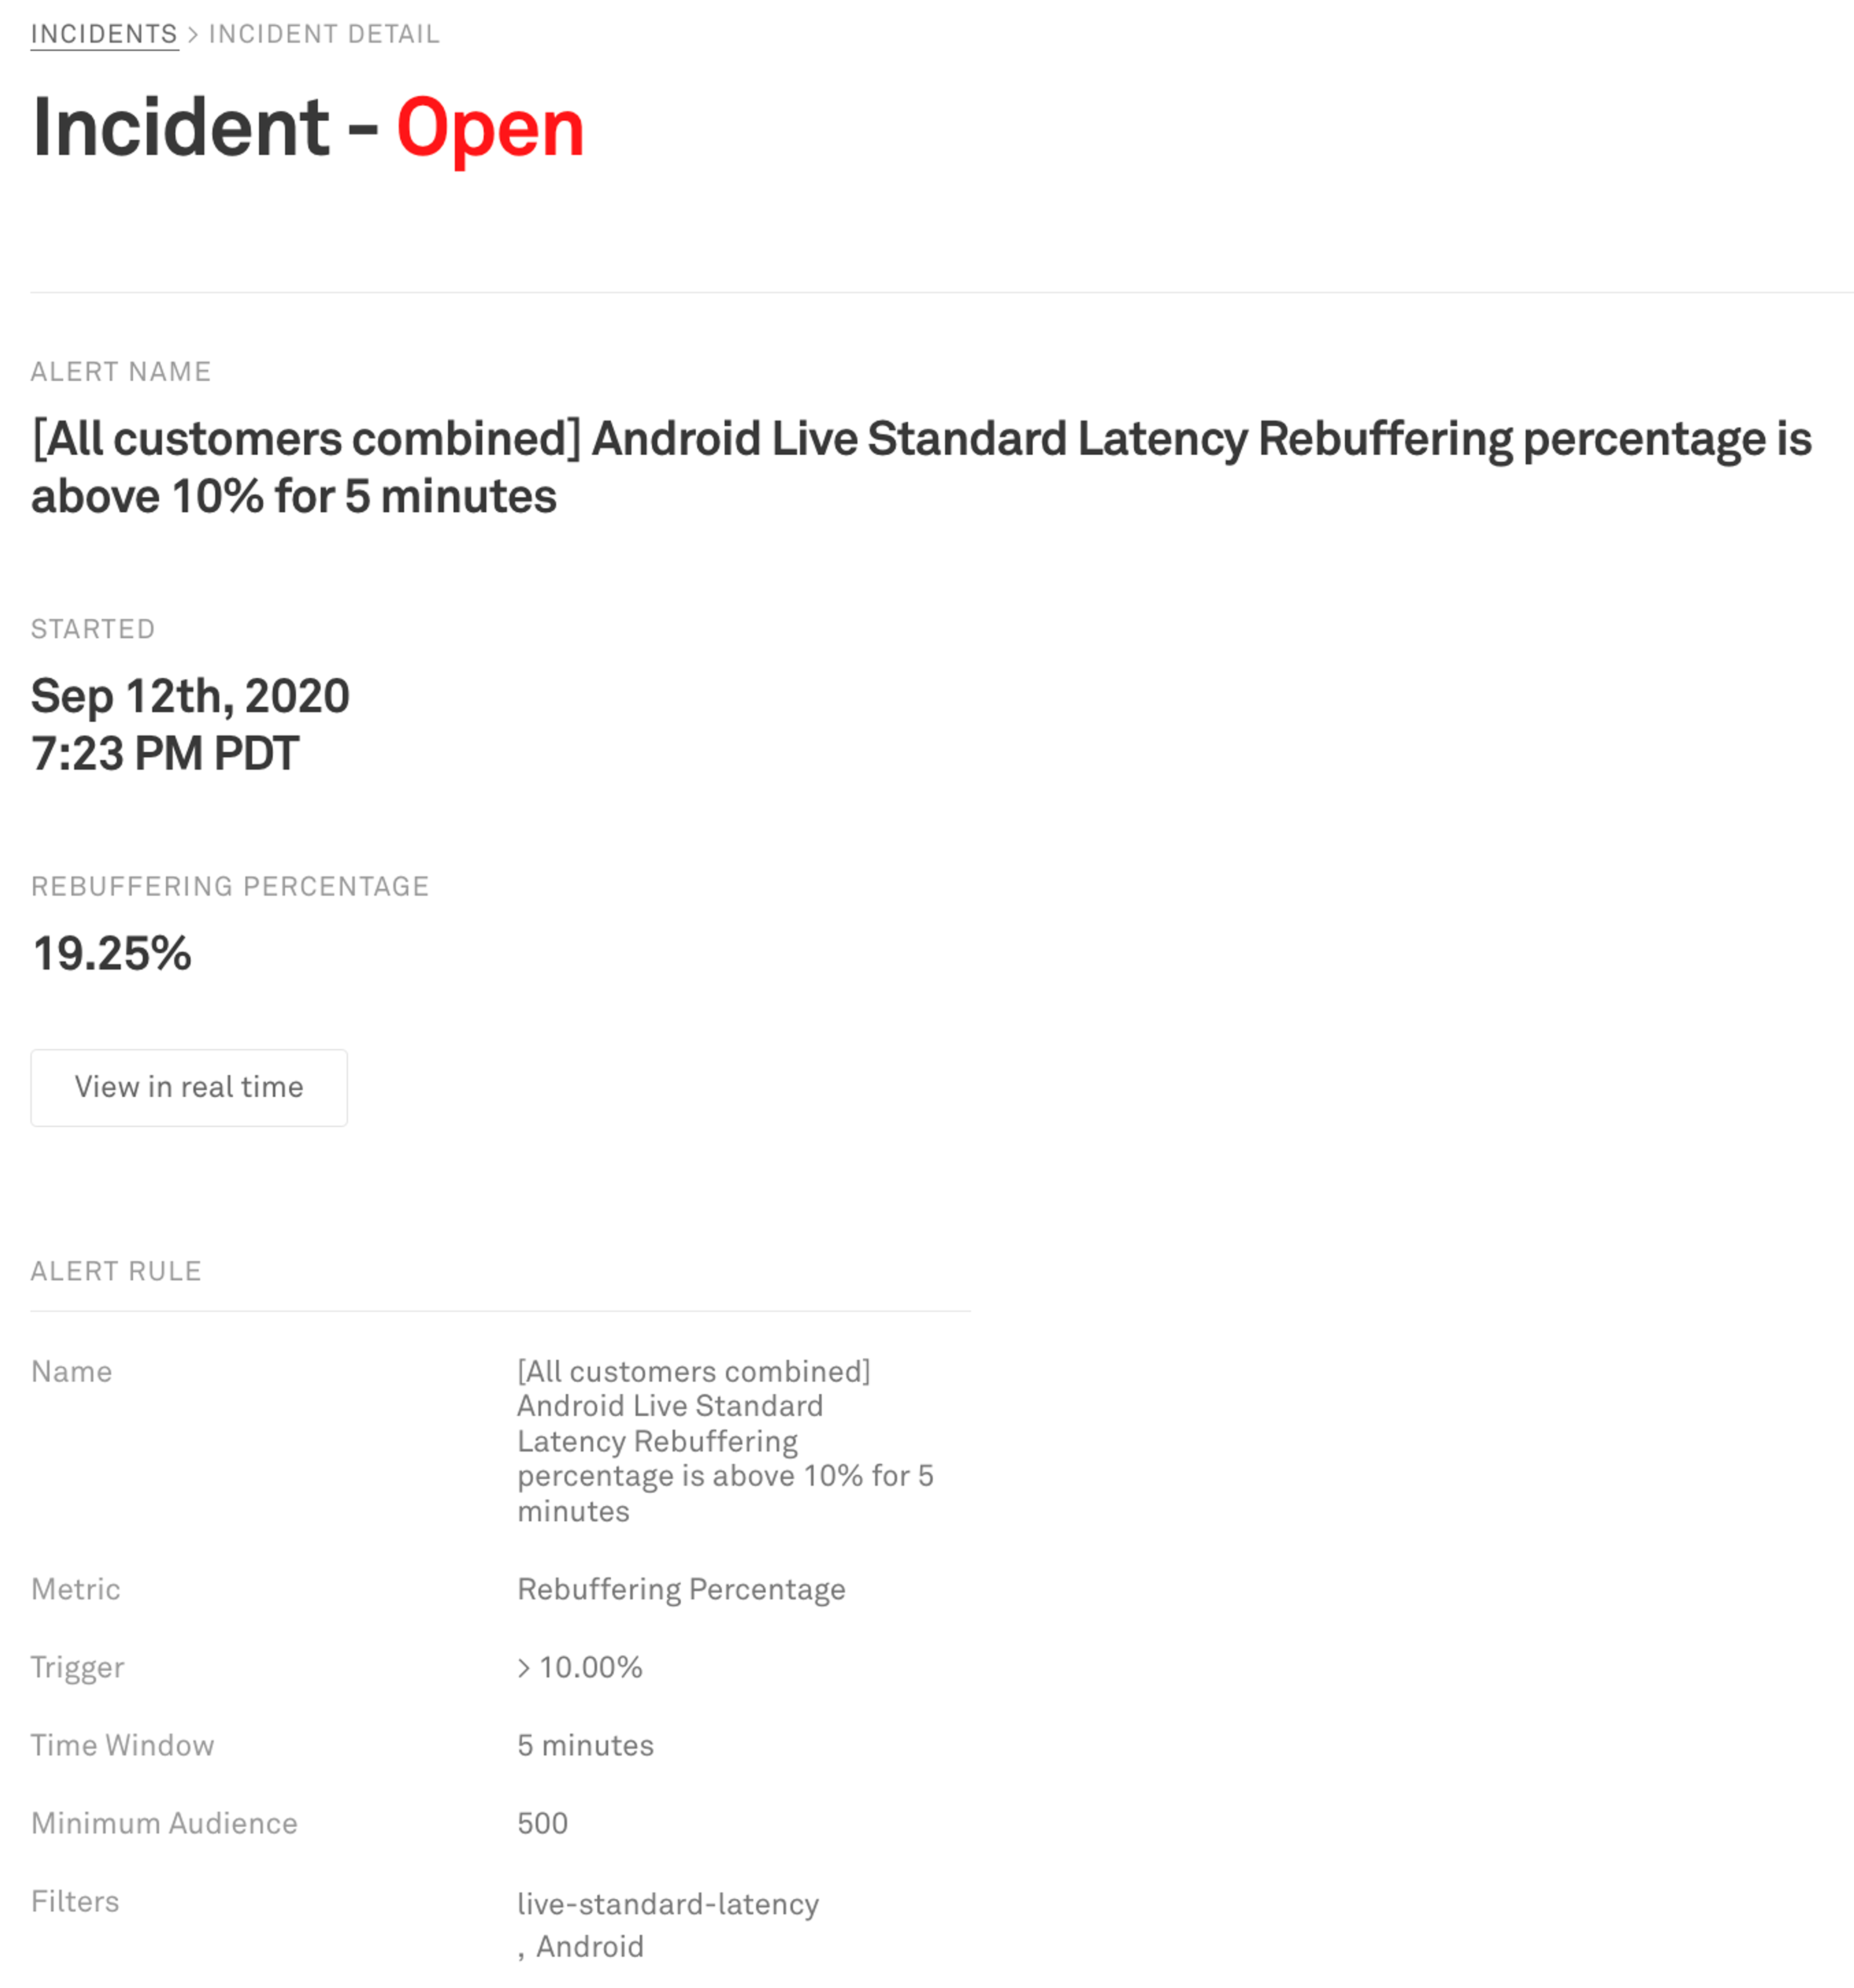
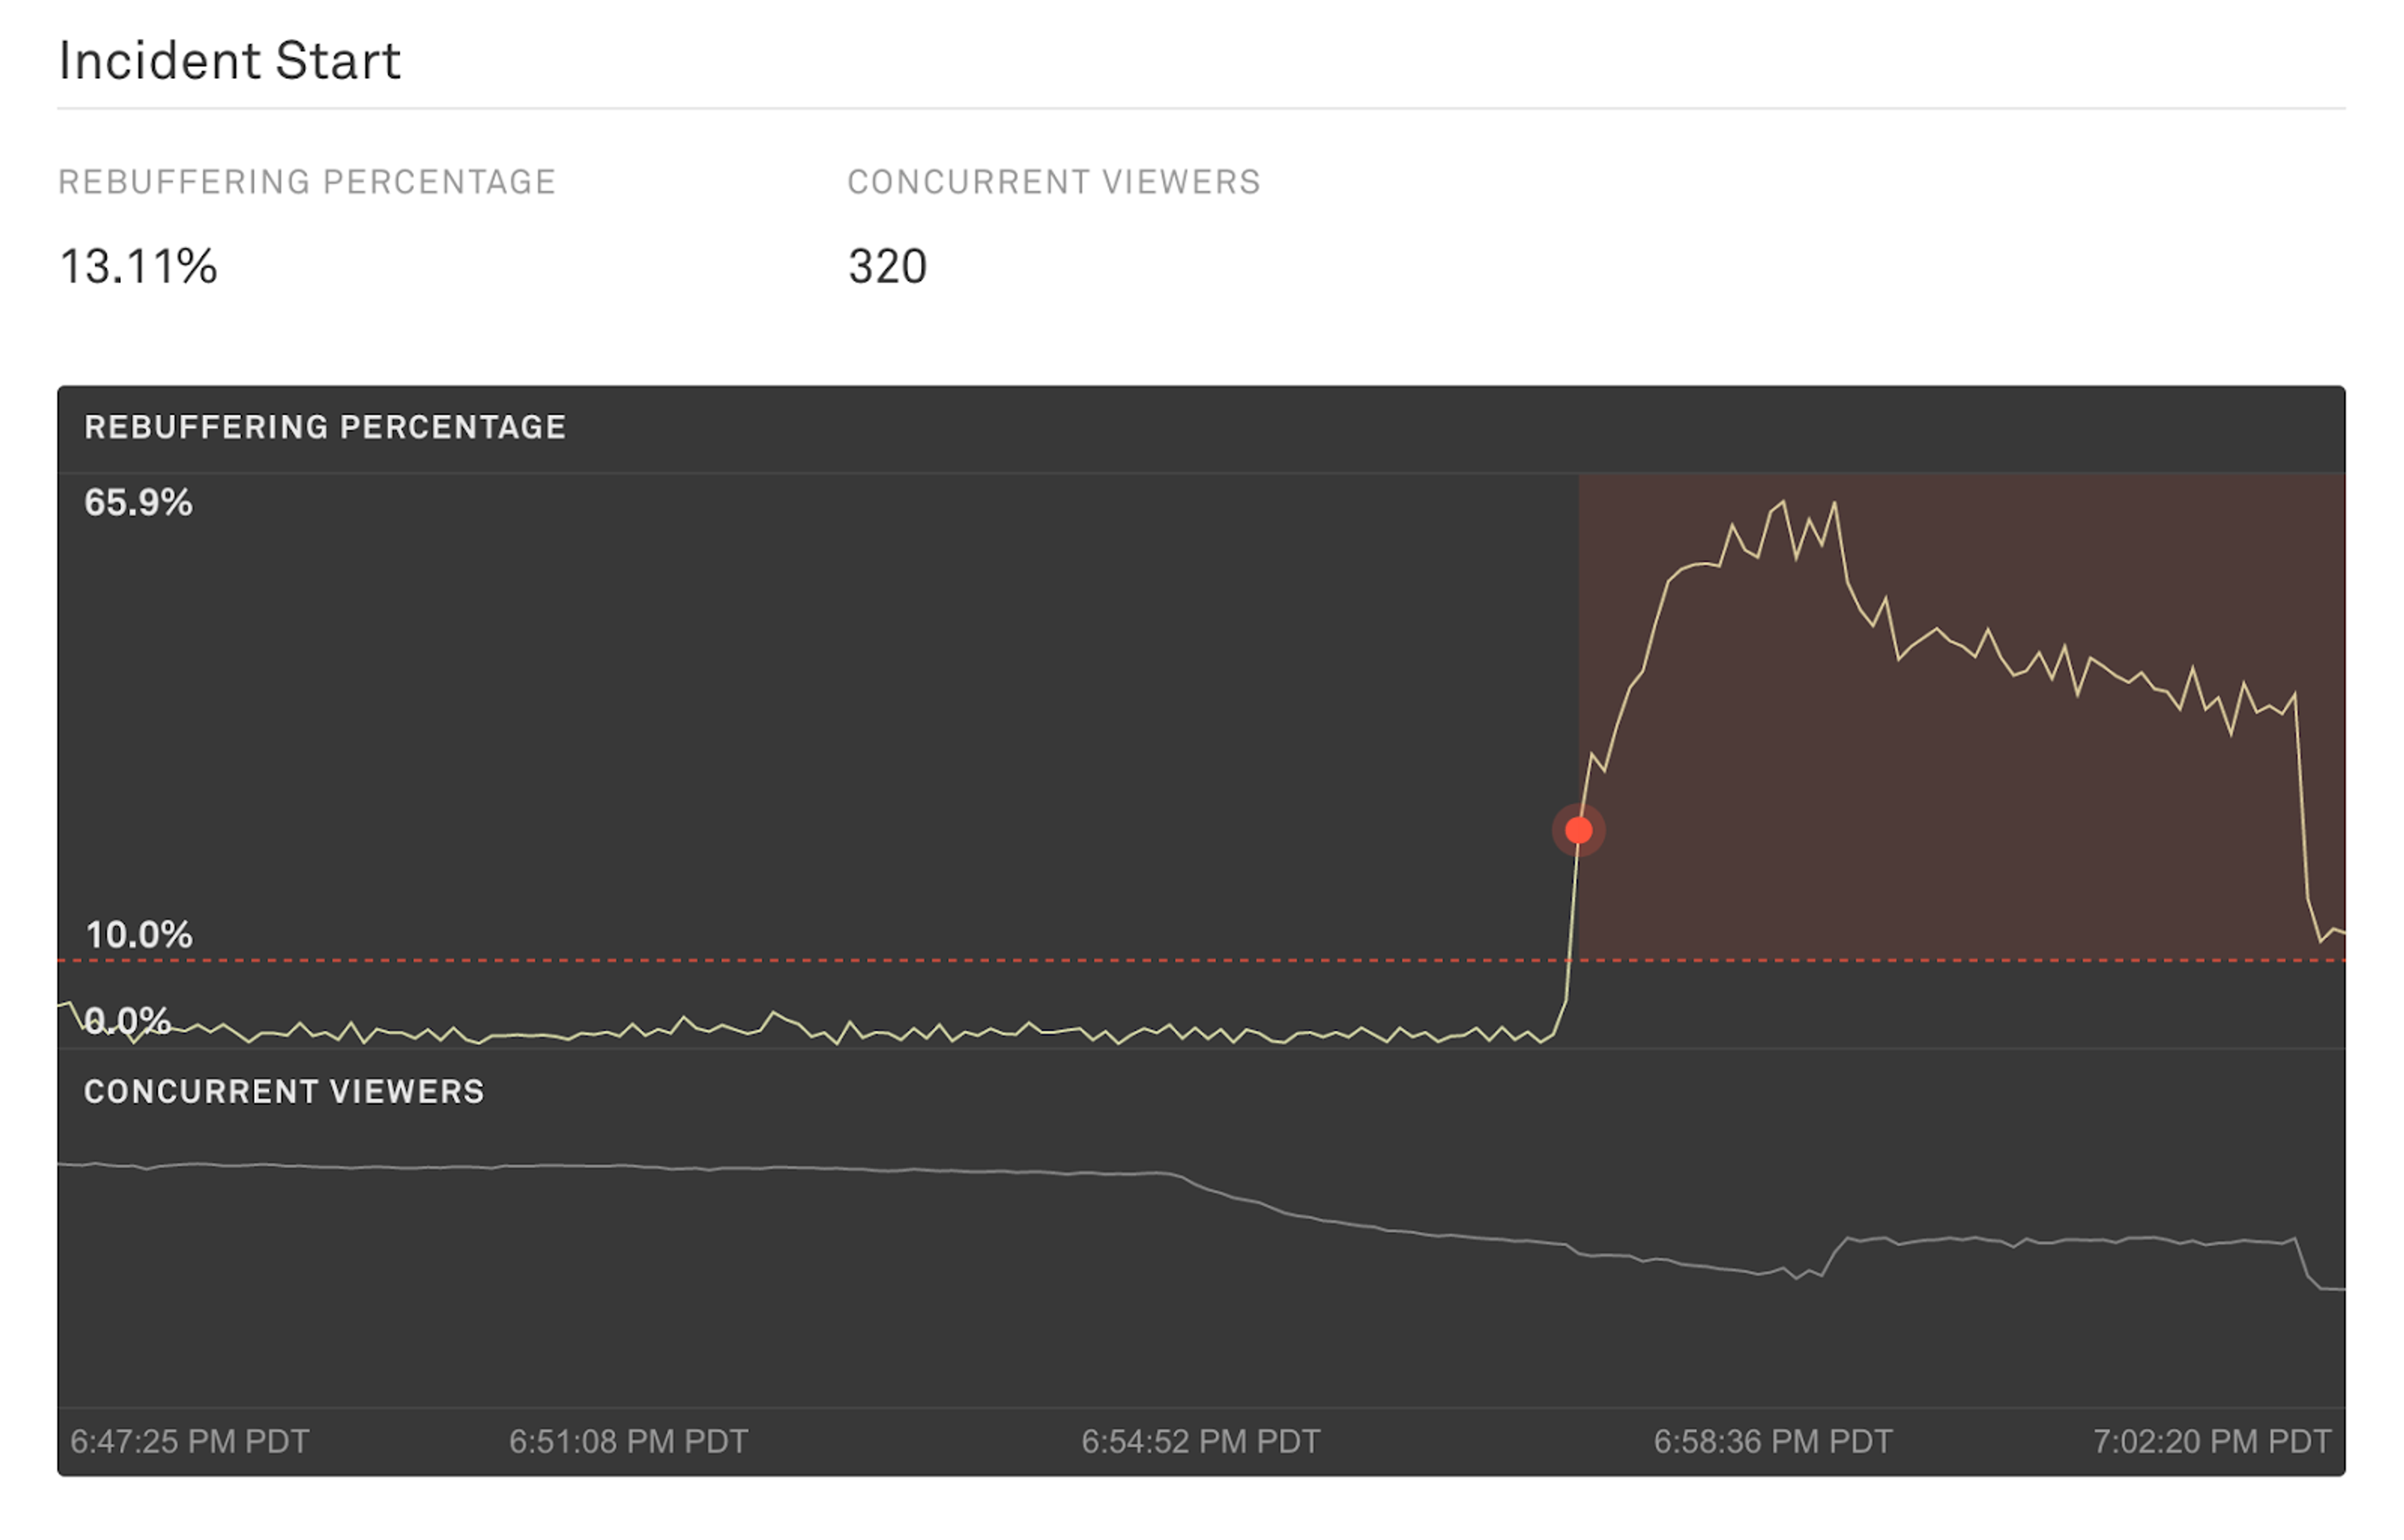
Sometimes alert conditions happen immediately and the metric will spike, other times the metric will rise more slowly over time. The chart on the alert incident shows the time leading up to the alert condition and up to five minutes after the alert condition is met. This allows you to get a feel for the behavior of the system before the incident.
Summing up the post-mortem
When the problem has been resolved, it’s time for the post-mortem. All of the important information about the issue is captured in the alert incident for viewing later.
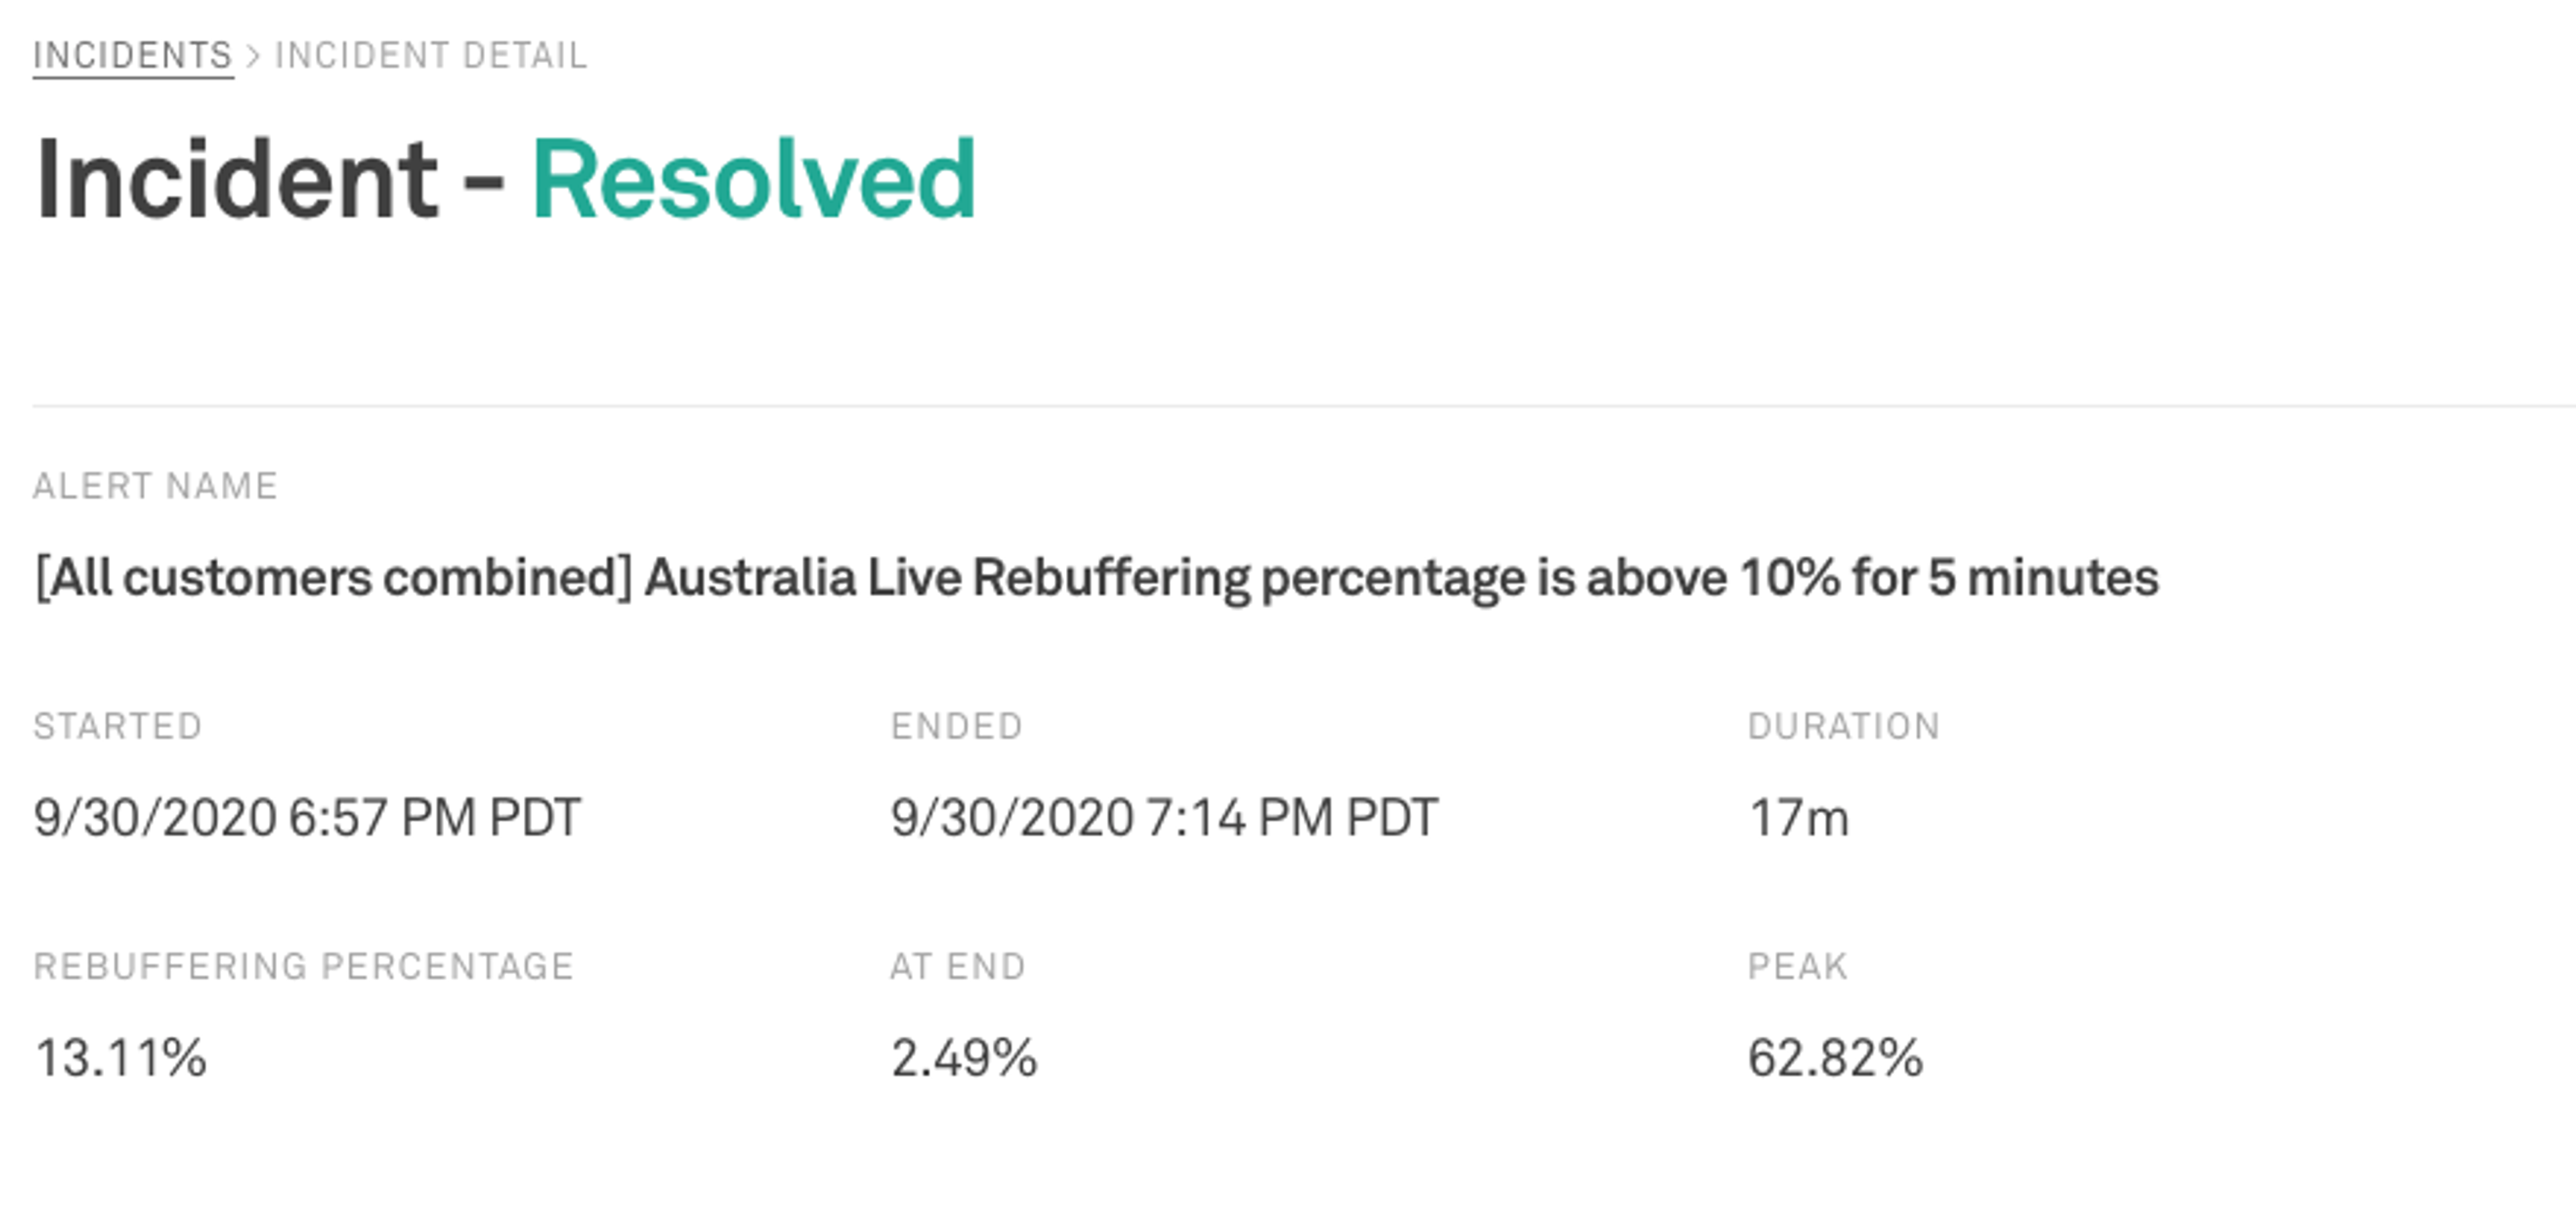
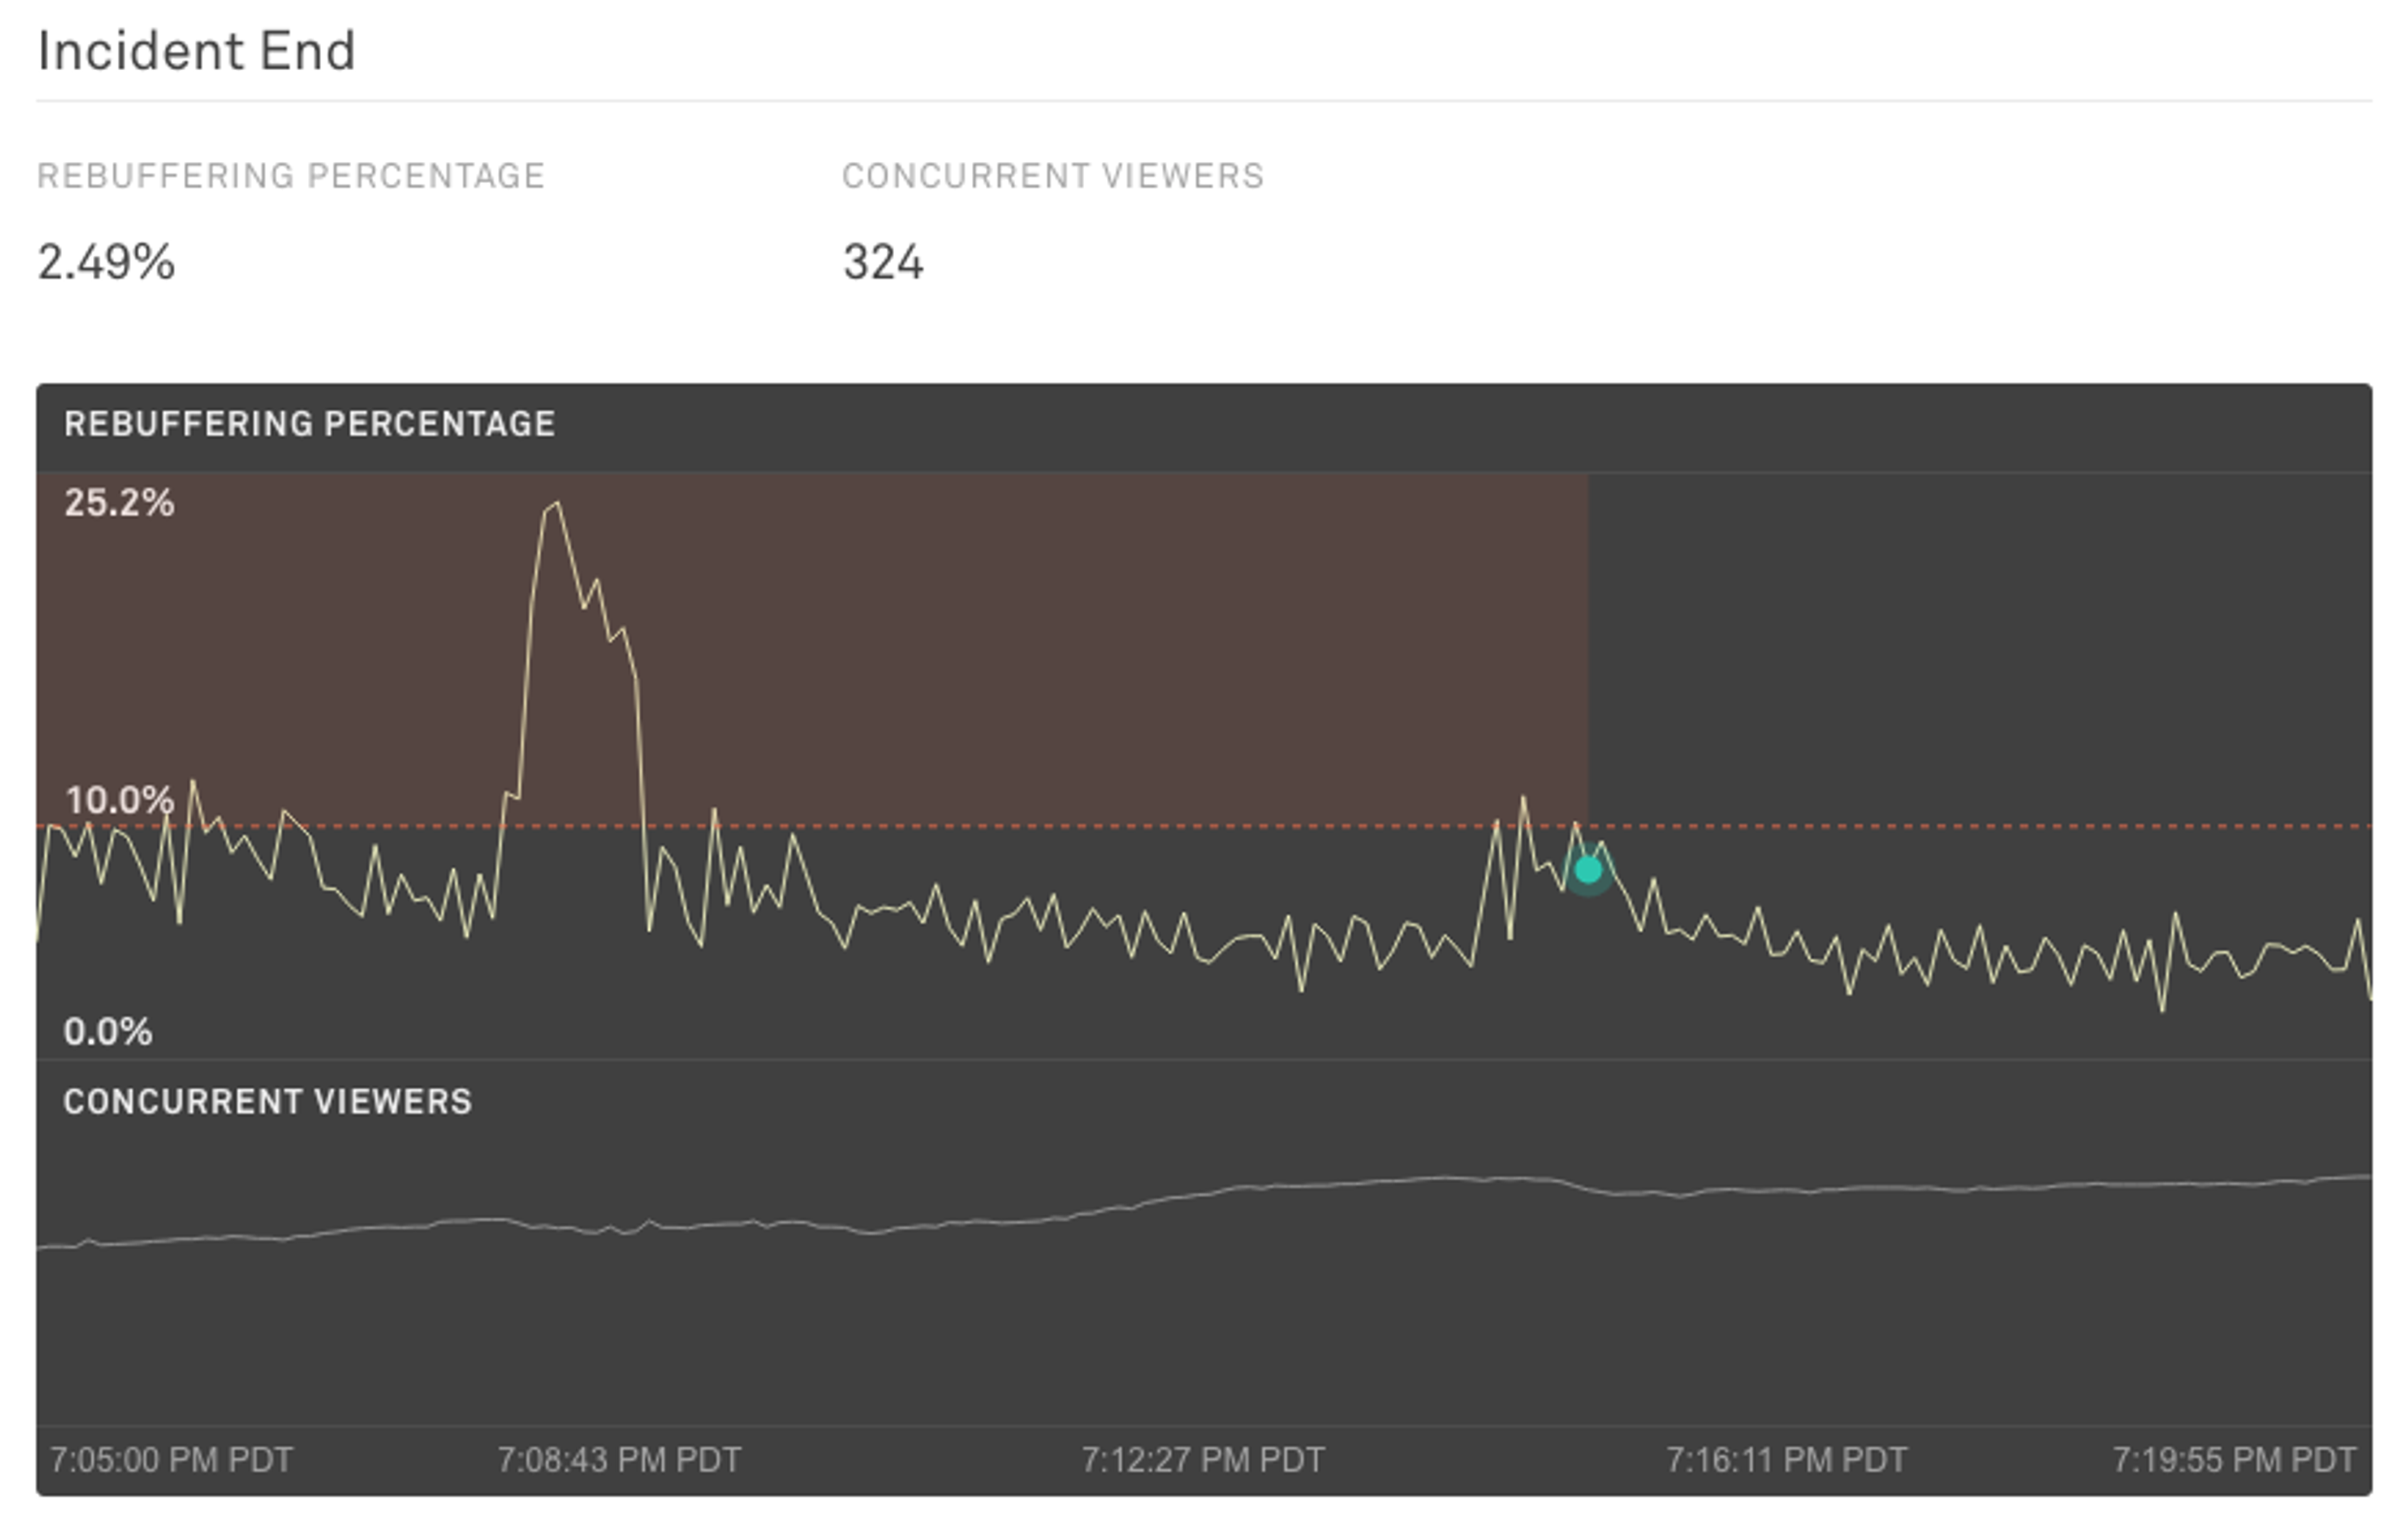
An additional chart snapshot is generated showing the metric as performance improves. You are able to see the last ten minutes of the alert (assuming it lasts long - if not, good job on a fast resolution!) and as well as a few minutes post-incident in order to give you more information about how the system is performing after resolution.
Release
Threshold Alerts for Mux Data is rolling out to all customers subscribed to Media plans. Our existing Anomaly Alerts continue to automatically look for failure conditions just as before and continue to be available to all users on Professional or Media plans.
We hope you find these alerts helpful and that it makes working with Mux Data easier than ever before. Please let us know if you have any feature requests or if it helps you identify an issue. We love to hear about all of the ways you use Mux Data!