There’s no better example for “no news is good news” than in the world of live streaming because the consequences of not having a live stream go smoothly are so impactful - if there’s a hiccup or any amount of rebuffering, viewers could potentially miss out on an important moment. And if the live experience doesn’t meet their expectations, they’ll quickly move to another platform that will. We want you to be able to provide reliable, awesome live experiences so we’re excited to release this feature that can help.
We’re happy to introduce Live Stream Input Health - a dashboard which shows you the health of your live stream as it’s happening. These metrics were specifically selected so they can help your team monitor and quickly assess the performance of a live ongoing event. The metrics include information from your stream, encoder, and webhook events.
The time series graph shows the last 60 minutes of incoming video bitrate, audio bitrate, and frames per second. There’s a variety of insights you can get from the different permutations of each metric. We’ve included an example of what an analysis might look like below.
The Events section shows the webhook events as they get fired for your specific live stream so you can see, for example, every connect and disconnect during the displayed time.
Finally, the Encoder Settings shows what settings Mux is seeing so you can validate what you configured on your end. The encoder setting is what your encoder is configured as and it can be good validation to see what we’re actually receiving. For instance, if your encoder is configured to encode a video stream at 5Mbps but on this dashboard it says we’re only receiving 3Mbps, that could indicate constraints on bandwidth. Other metrics, like having a constant framerate, could help further validate there is an issue.
Example Analysis
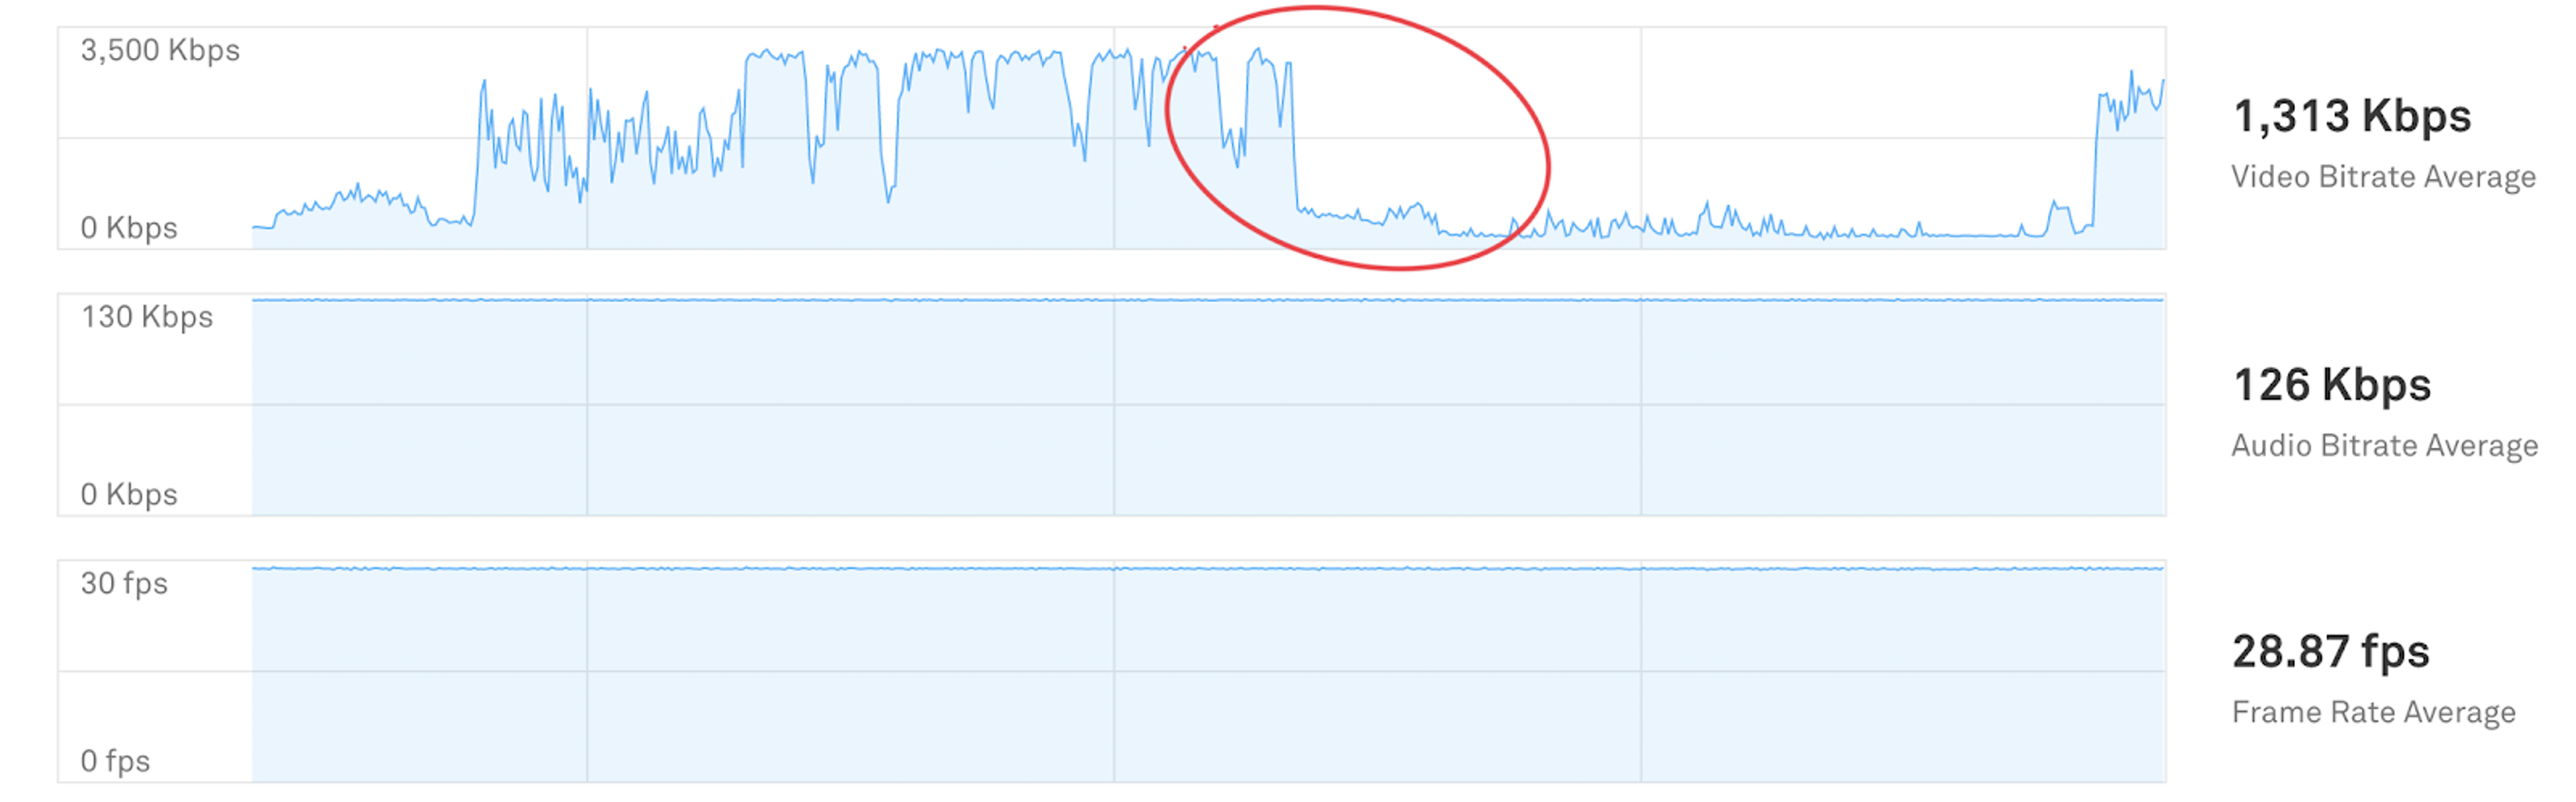
Here we see some good news and bad news: the audio looks pristine, there’s no drops in frame rate, but there’s clearly something going on with the video bitrate. By just looking at bitrate variation, the encoder is likely configured with Variable Bitrate (VBR) mode. This means the encoder is trying to optimize the number of bits used to encode the video frame. However, the video players can’t anticipate that change, so switching to a higher quality could increase interruptions. In addition, the actual average video bitrate seems low which indicates that the viewer’s Quality of Experience (QoE) likely isn't great. However, the steady frame rate average suggests that you have a healthy encoder and good network connectivity.
We understand that not everyone who is monitoring a live stream may be a video analytics expert that can decipher what the dashboard says. So that’s why we’ve created this guide with more examples and analyses to give you a starting point in understanding the metrics in the dashboard.
Pricing
Live Stream Input Health is now available for all Mux Video customers at no extra cost. 🎉 It comes with Mux Video, meaning you don’t have to sign up for the Mux Data product to access this feature.
Overall, we hope this dashboard helps you deliver as flawless of a live stream as possible by helping your team understand, triage, and resolve any issues quickly. We’re already working on updates to this dashboard so stay tuned as we help make this data even more actionable.