When we launched Mux Data nearly four years ago, we included the ability to drill deeply into each individual view directly in the dashboard. We have since iterated on this feature a few times, adding full CSV exports and adding a unique visual representation of the view. However there was still room for improvement: certain important metrics (and scores) were absent from the page, and the actionability wasn’t quite where we wanted it to be.
So, we took another stab at it.


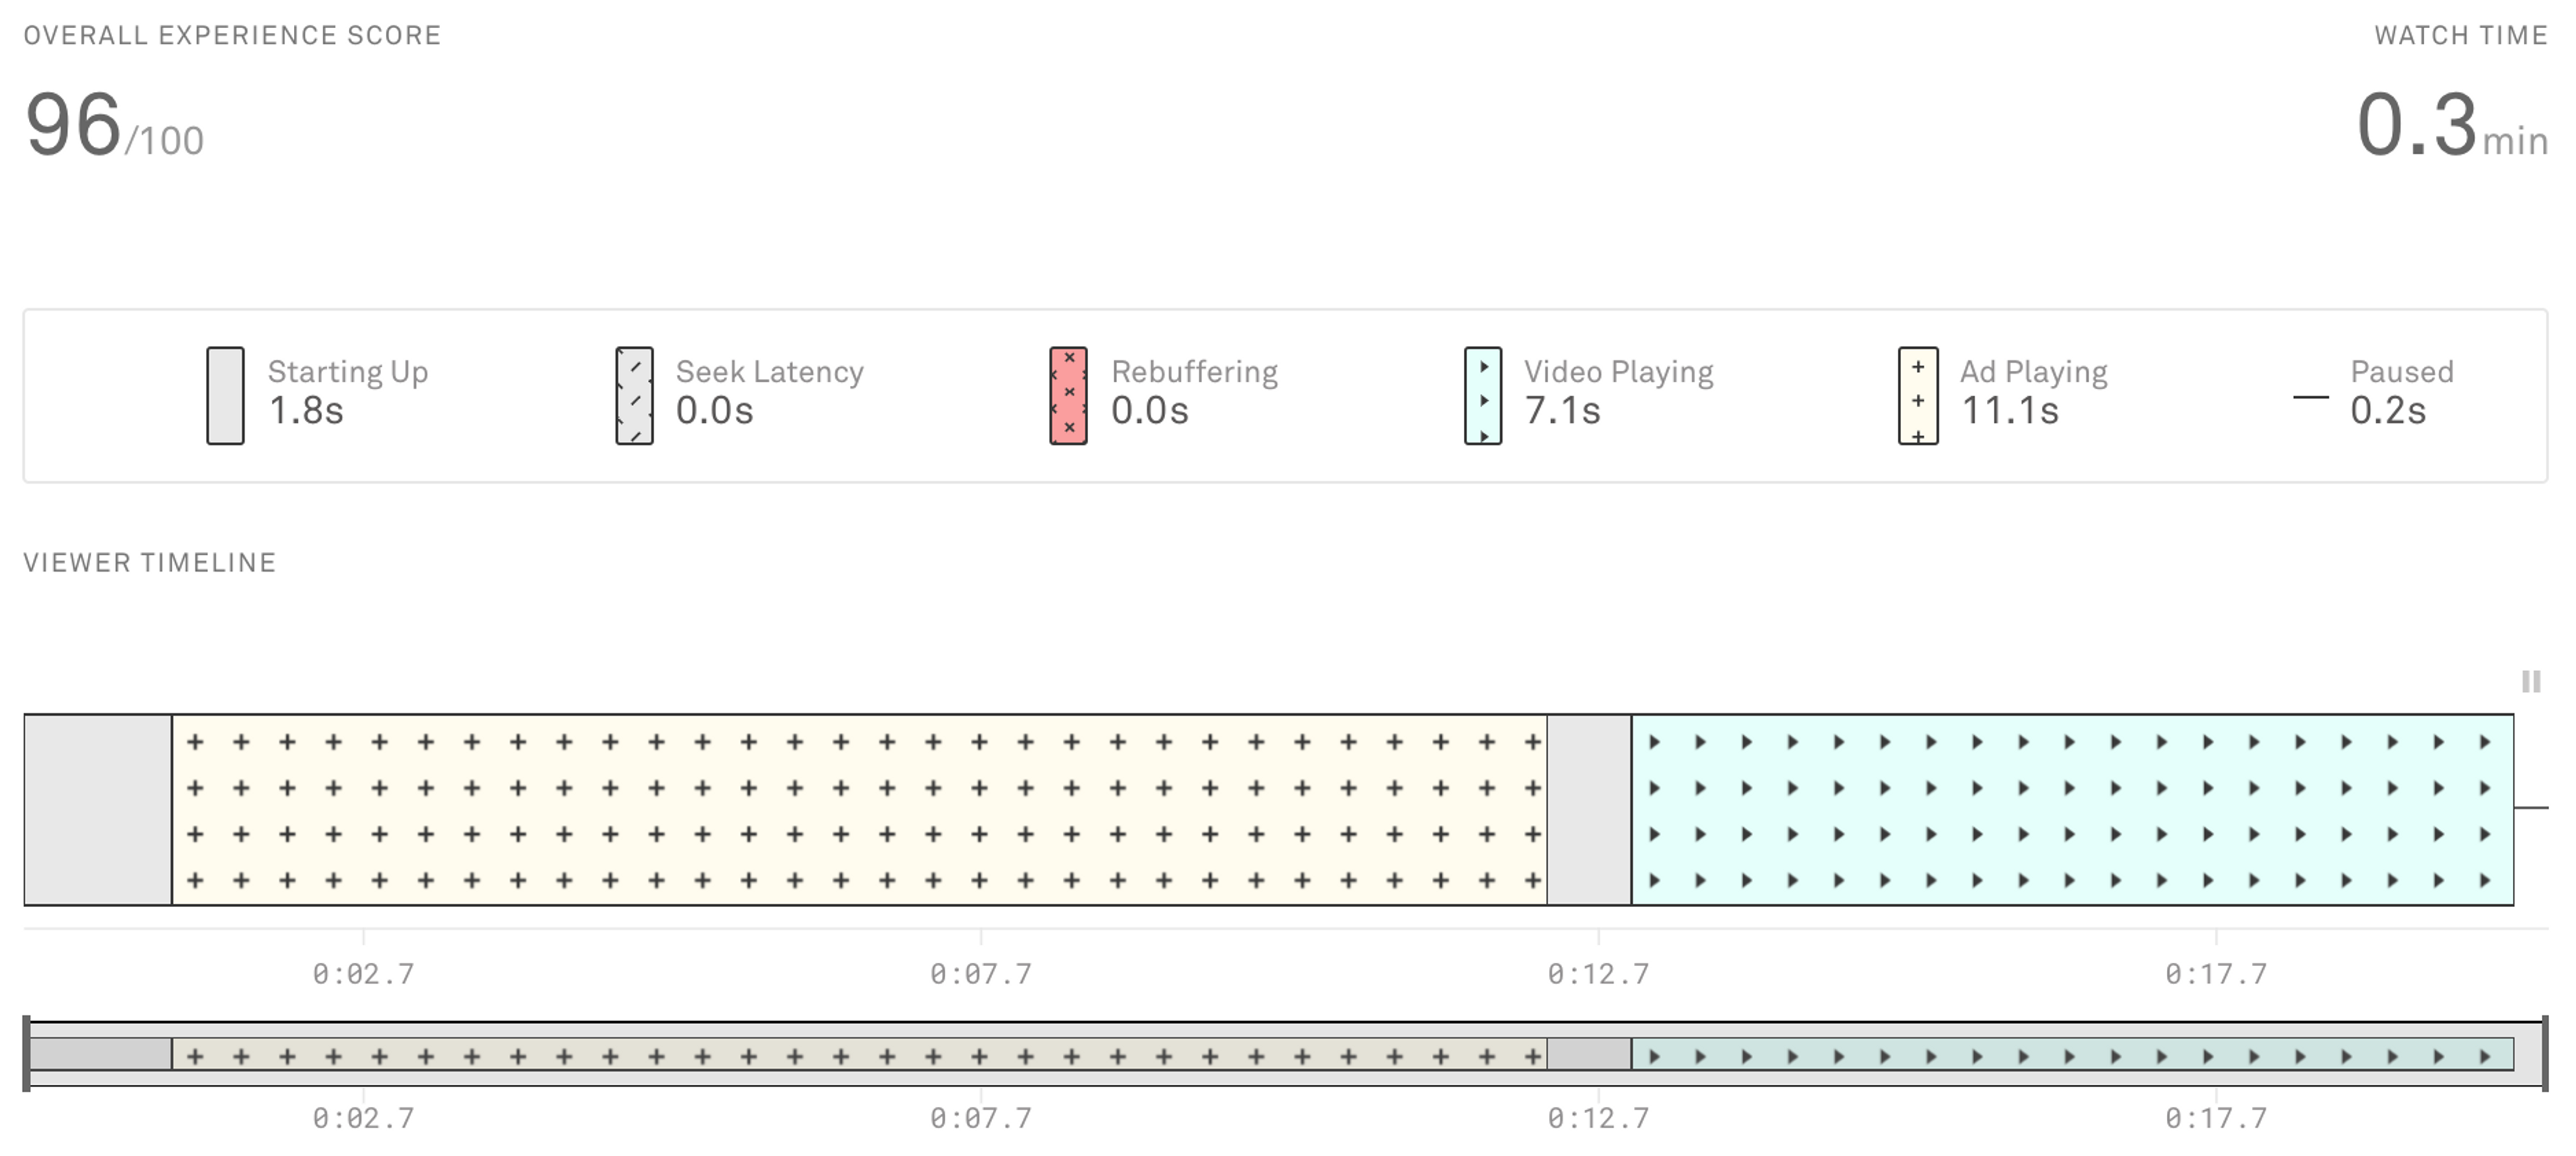
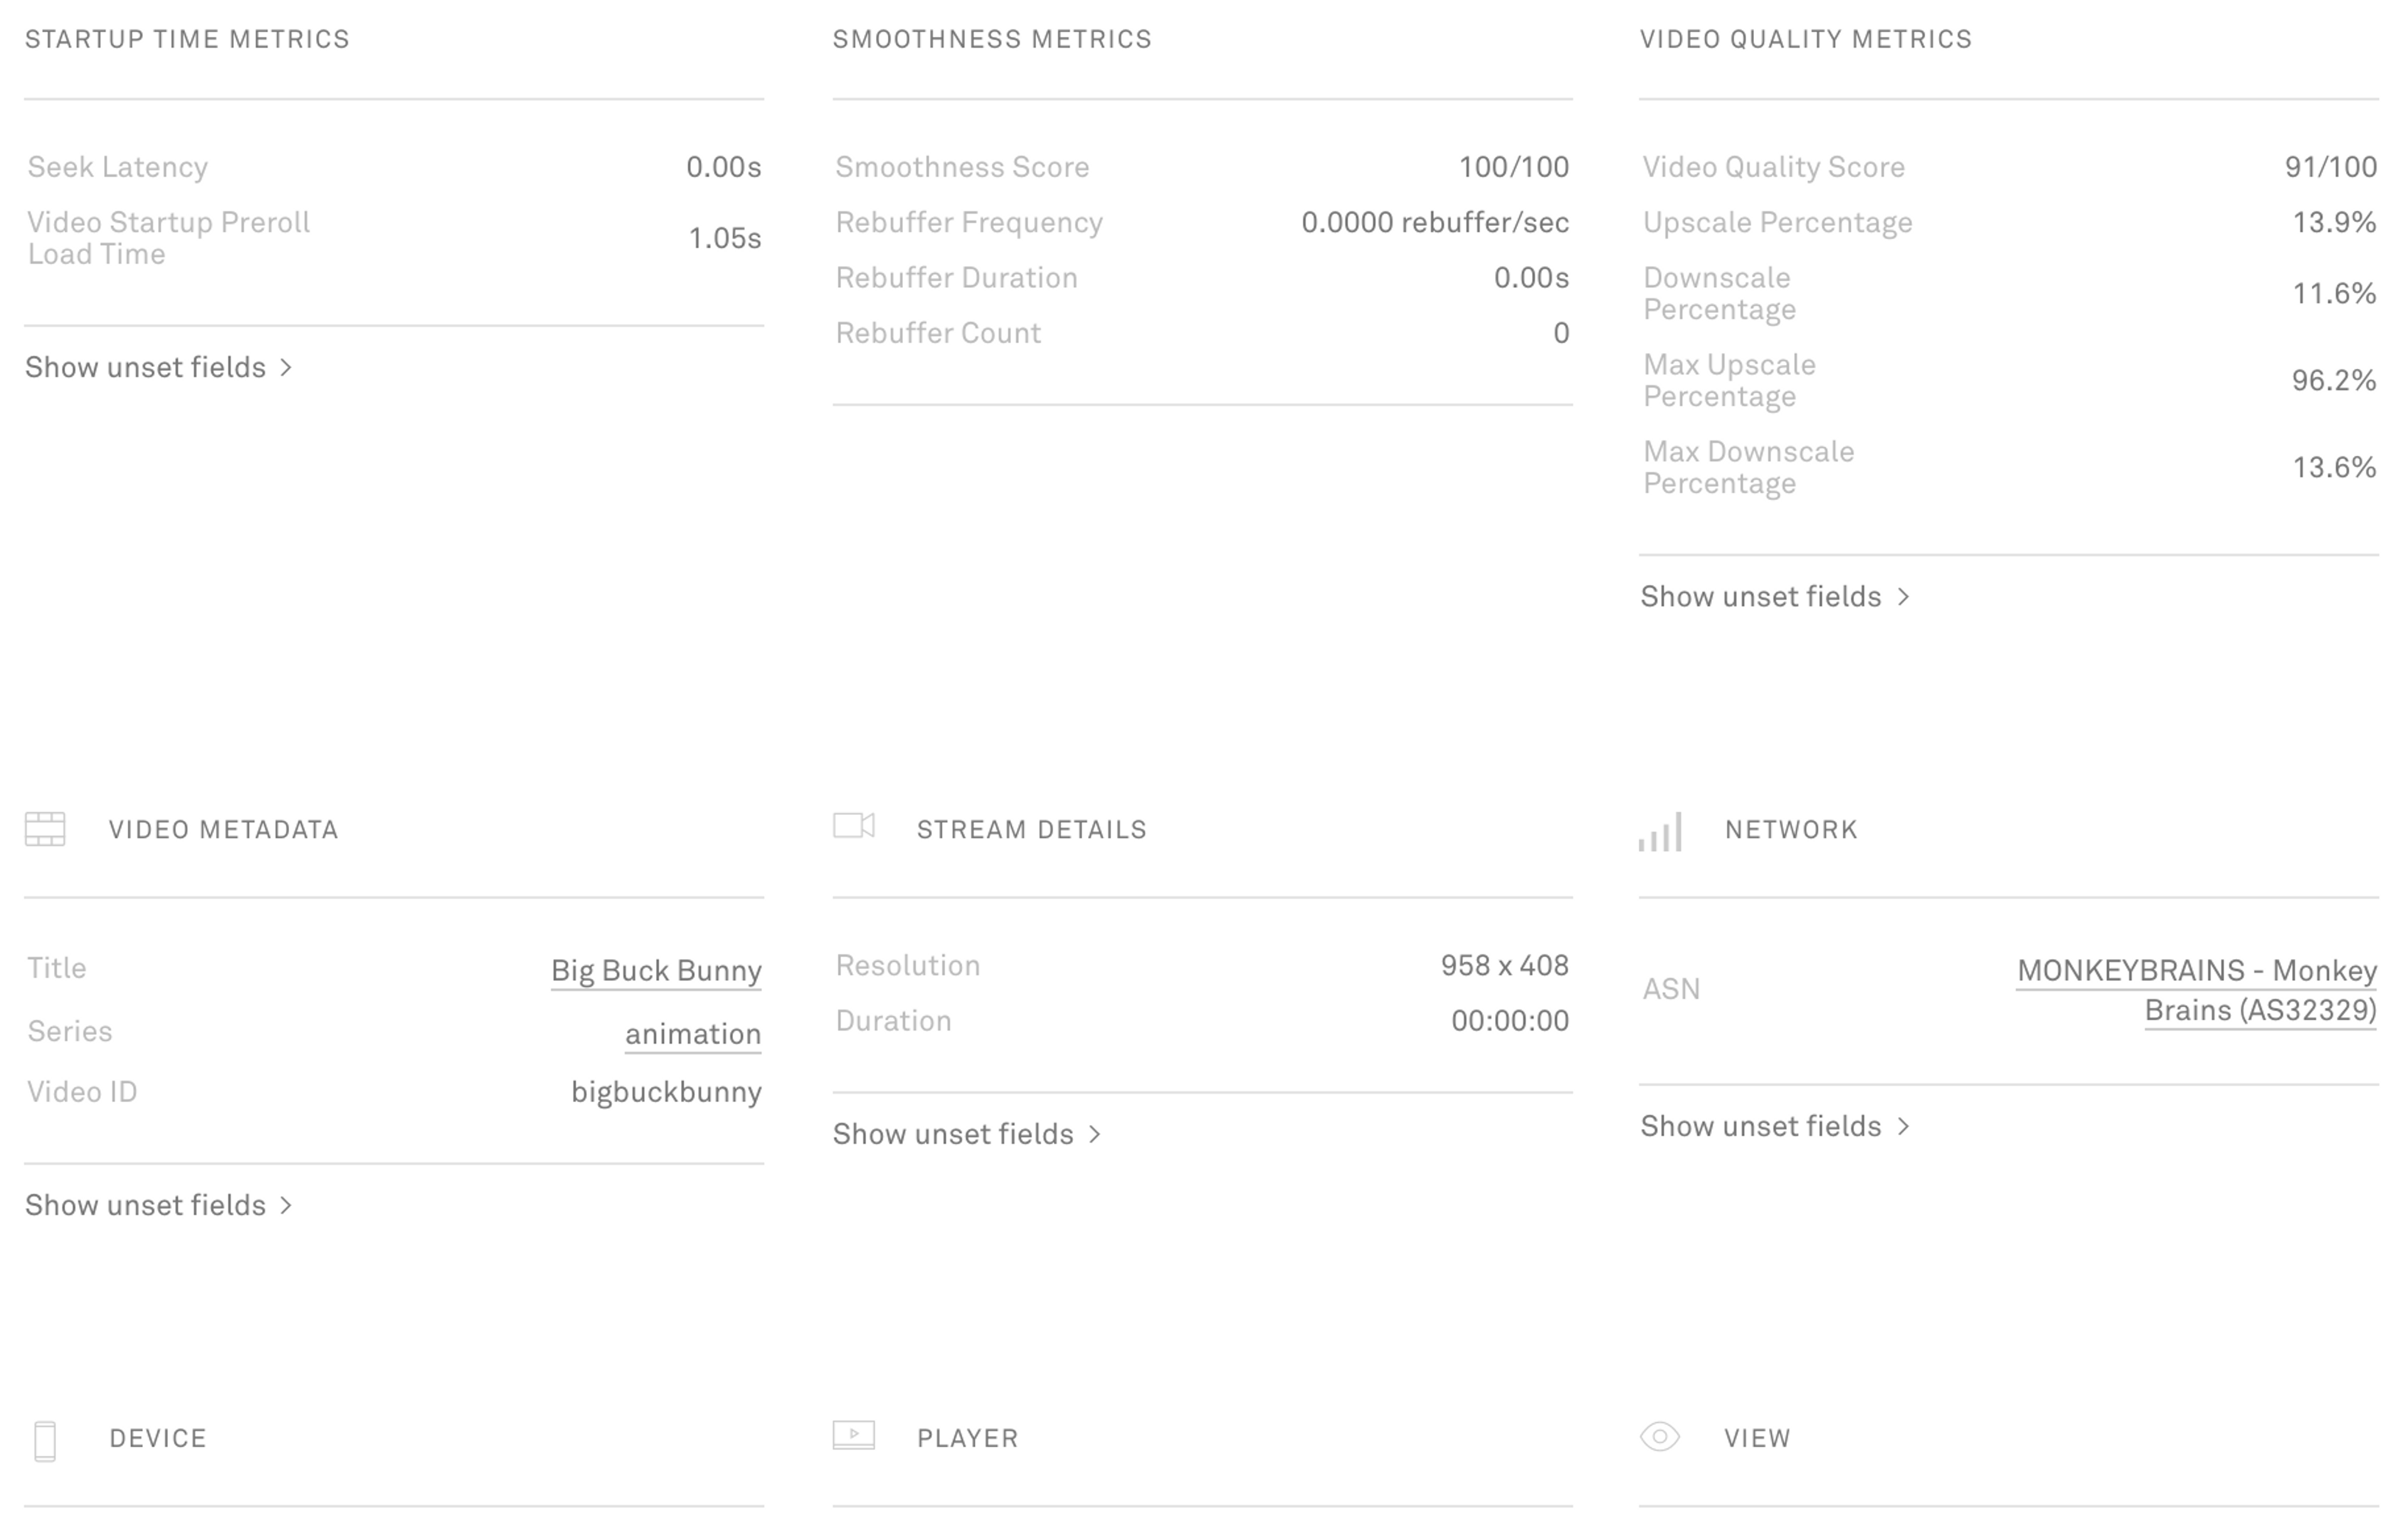
Apologies for how small that is, there’s just too much to show. A few of the changes rolled in here include:
- Added many more metrics and dimensions to the page, including each of the Viewer Experience Scores
- Rearranged the layout of the metrics and dimensions in order to make the information more easily accessible, by grouping metrics and dimensions in categories that make sense
- Redesigned the Viewer Timeline to help display more clearly what’s good, bad, and necessary evil (cough ads cough)
In addition to the above, we’ve enhanced actionability of the data within this page. We now differentiate between dimensions that you are not taking advantage of vs dimensions that the SDK cannot retrieve, so that you can more easily find places where you can augment the data being tracked by Mux or pinpoint an issue within an SDK. Lastly, for dimensions that you think may be important to dig into more deeply, we’ve added links that take you directly to a filtered list of similar video views.
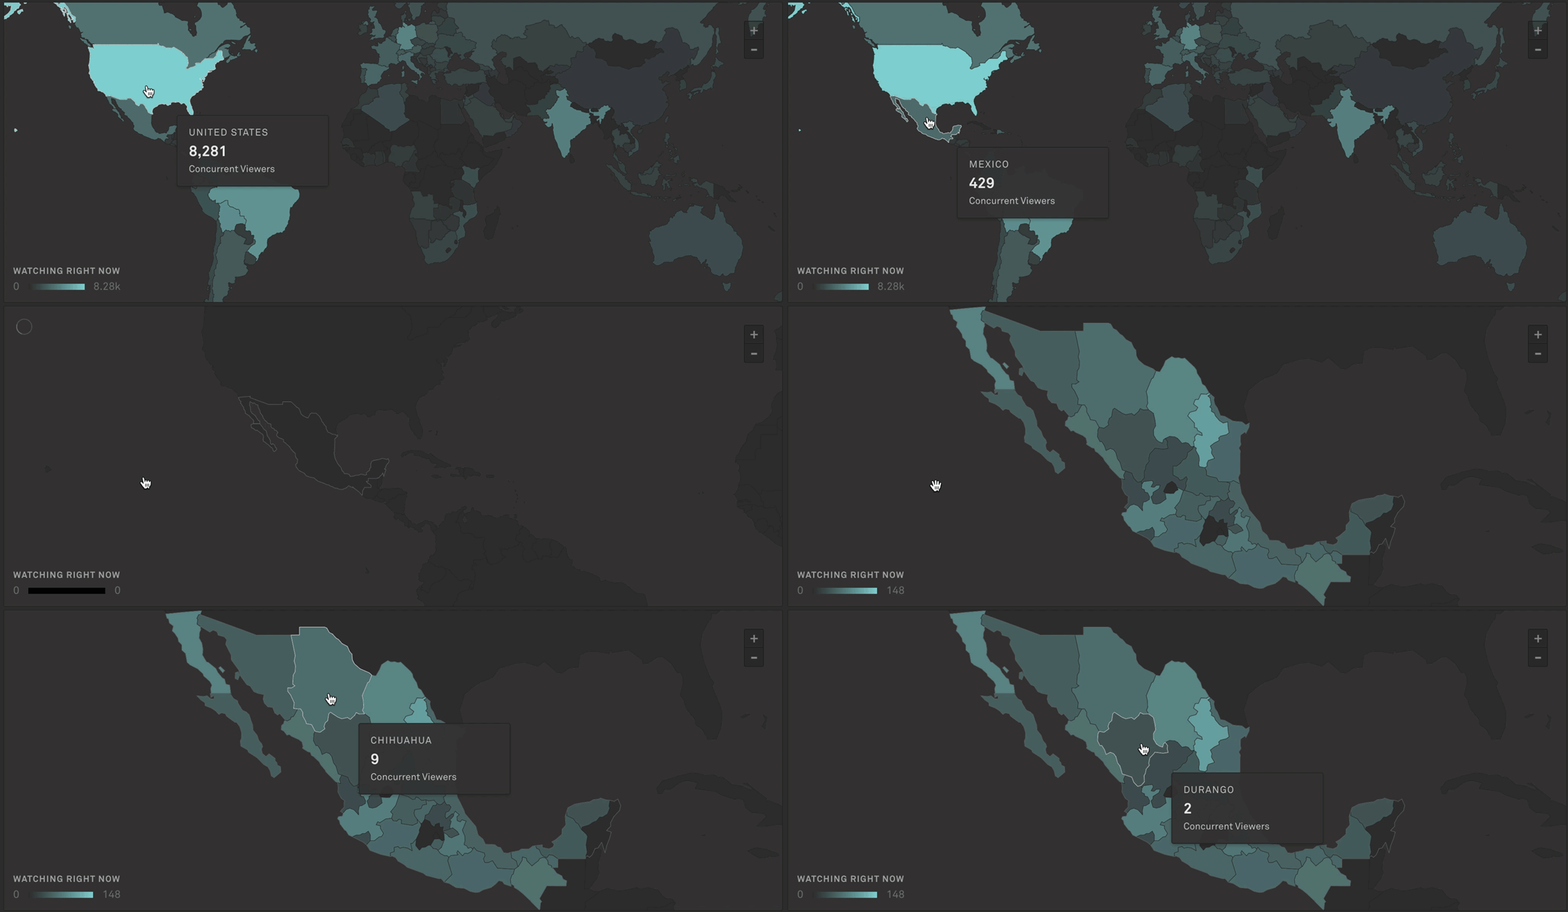
There’s one other existing feature that we’ve improved (sharp readers probably knew this was coming anyway): finer detail within the realtime map. When we first launched our Real-Time Streaming Dashboard (and for those interested in the technology behind the scenes, there’s a great blog post on that, too!), we spent a lot of page real estate on a large world map. Initially, that map only showed you a breakdown by country, and one of the most common feature requests we received was to be able to go deeper.

Now when you filter by a country (either via the map or just by adding a filter), the map will automatically zoom in to that country, and show the concurrent viewer count within each region. These regions depend on the country, but they’re typically something similar to what States are to the US. This will allow you to see, in real time, a more fine-grained breakdown of regional viewership of your content.
We’ve been hard at work creating new features and functionality here at Mux, all with the goal of helping our customers build better video. But that doesn’t mean we don’t want to show some ❤️ to some of our original features. If you have any suggestions on improvements to our product that we can make, get in touch! Also, when you sign up for Mux Data, you get a 14-day trial of our Pro tier, so sign up today and start tracking your video performance.


