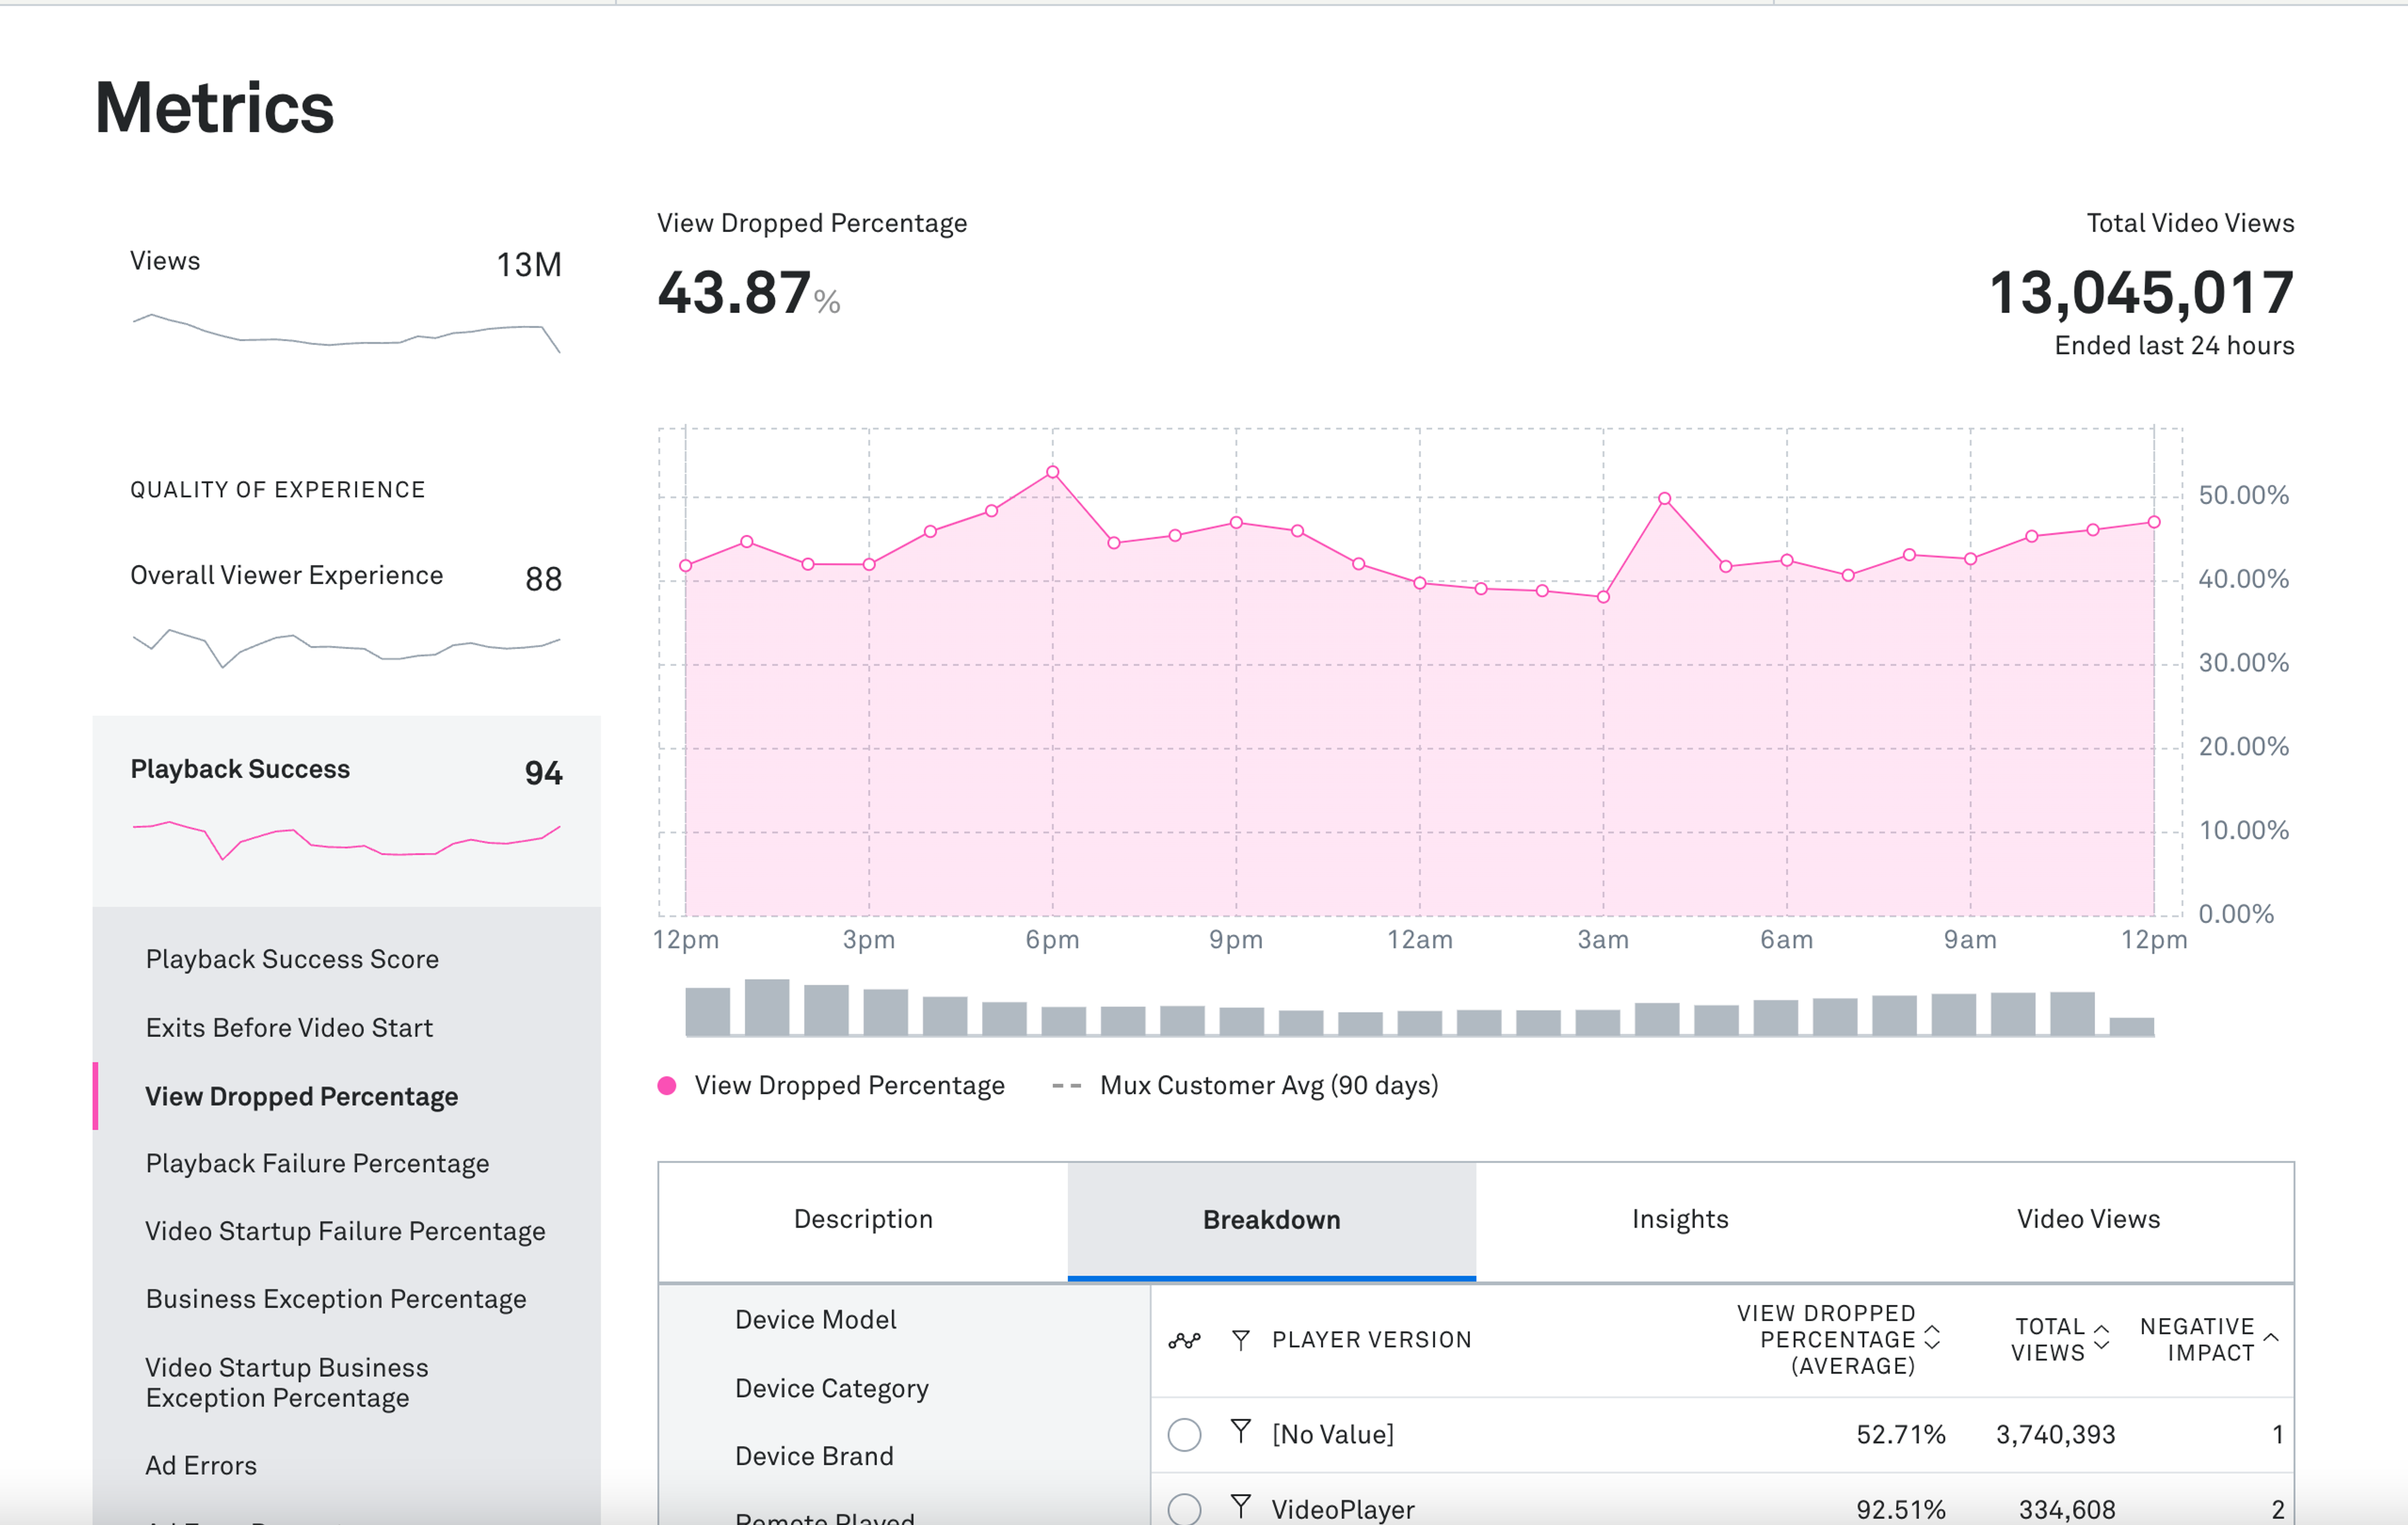
Analyzing QoE is kind of like solving a mystery. You’re trying to understand the who, what, when, and where of playback issues so you can provide your viewers with the best experience. What’s happened and who (well, which part of your workflow) dunnit?
When we add new metrics or filters, we’re thinking about what hints can help you solve those QoE mysteries. The mystery we’re tackling today: Why a view ends.
Most of the time, we get a clear signal of a view ending. Other times, that signal doesn’t make it or was never sent and, in those cases, we count a view as “dropped”.
To help you understand these views, we are launching a new metric in Mux Data: View Dropped Percentage. Using this overall general health metric, you’ll be able to see trends in views that drop over time. Not sure why this matters? Read on!

Understanding View Dropped Percentage
In Mux Data, a view can end in one of two ways. It can end based on a known viewer action such as closing the player or exiting the page. When this happens, it is highly likely that the viewer intended to stop watching the video based on their interaction with the video player. This will appear as a viewend event in Mux.
There are instances when Mux never receives a signal that the viewer has ended the playback session. If playback is not actively happening, we wait for a signal for 60 seconds, after that, we consider the view “dropped” and insert a viewdropped event. If the viewer then resumes playback in the same session, we’ll remove the viewdropped event, insert the remainder of the playback events, and end the view when it’s stopped. For example, someone presses pause to pop some popcorn, after 60 seconds, Mux will consider this view dropped, and when they press play again, we’ll be back to tracking as usual.
However, sometimes these views never resume. It could be because the viewer pressed pause and then never came back to the session. Or they lost internet connection. These examples are all considered normal viewing behavior and all customers should expect to have a healthy portion of their views count as dropped views. This percentage may differ across players, applications, or devices and still signal normal viewer behavior.
So why would we track dropped view percentage if it’s a metric that could indicate normal viewer behavior? Well, sometimes these mysterious views could be hiding a technical issue. If there is a sudden player or application crash, Mux will not send a viewend event or error that signals an issue. If there was a consistent issue causing views to end due to a technical problem, you would see this percentage increase as an aggregate metric. Digging into a particular player, browser, or application, you can use Mux’s Negative Impact Scores to see if these dropped views are clustering in a specific direction.
Dropped Views is also available as a filter to isolate views that ended for unknown reasons. This can be helpful in identifying patterns across views and breaking down these views by the various players, browsers, or devices. Dropped Views is also available as a dimension.
Start solving data mysteries today
The View Dropped Percentage is available to all Mux Data customers through the Metrics API and Metrics Dashboard.
As always, reach out to us if you have any questions or let us know View Dropped Percentage helped you solve any great QoE mysteries.


