Mux Data is a powerful suite of tools that helps you build better video. The visual, user-friendly Mux Data Dashboard and the developer-oriented Mux Data API can give you a deeper understanding of your videos' performance, both individually and collectively.
This blog post shows how to use the Mux Data Dashboard and Mux Data API to generate valuable insights about your video metrics. As an example, we’ll look at how to use two endpoints from the Mux Data API to get data and create flexible, informative graphs.
Integrating Mux Data
Follow the Mux Data Guide for an introduction to our SDKs. The Getting Started guide outlines how to choose an environment, integrate with a player, add metadata, and start seeing data. A few minutes after integration, your data should show up in the Mux Data Dashboard.
Overview of the Mux Data Dashboard
The Mux Data Dashboard is used to monitor everything related to live streams or on-demand assets: critical events, performance, view counts, health, analytics, and more.
To select the environment, timeframe, and filters, use the top filter bar on the Dashboard. For this specific example, we’ll use a timeframe of one day.
The Data Dashboard Errors page
Accessible from the left navigation pane, the Errors page lists all errors that occurred during the timeframe specified. For example:
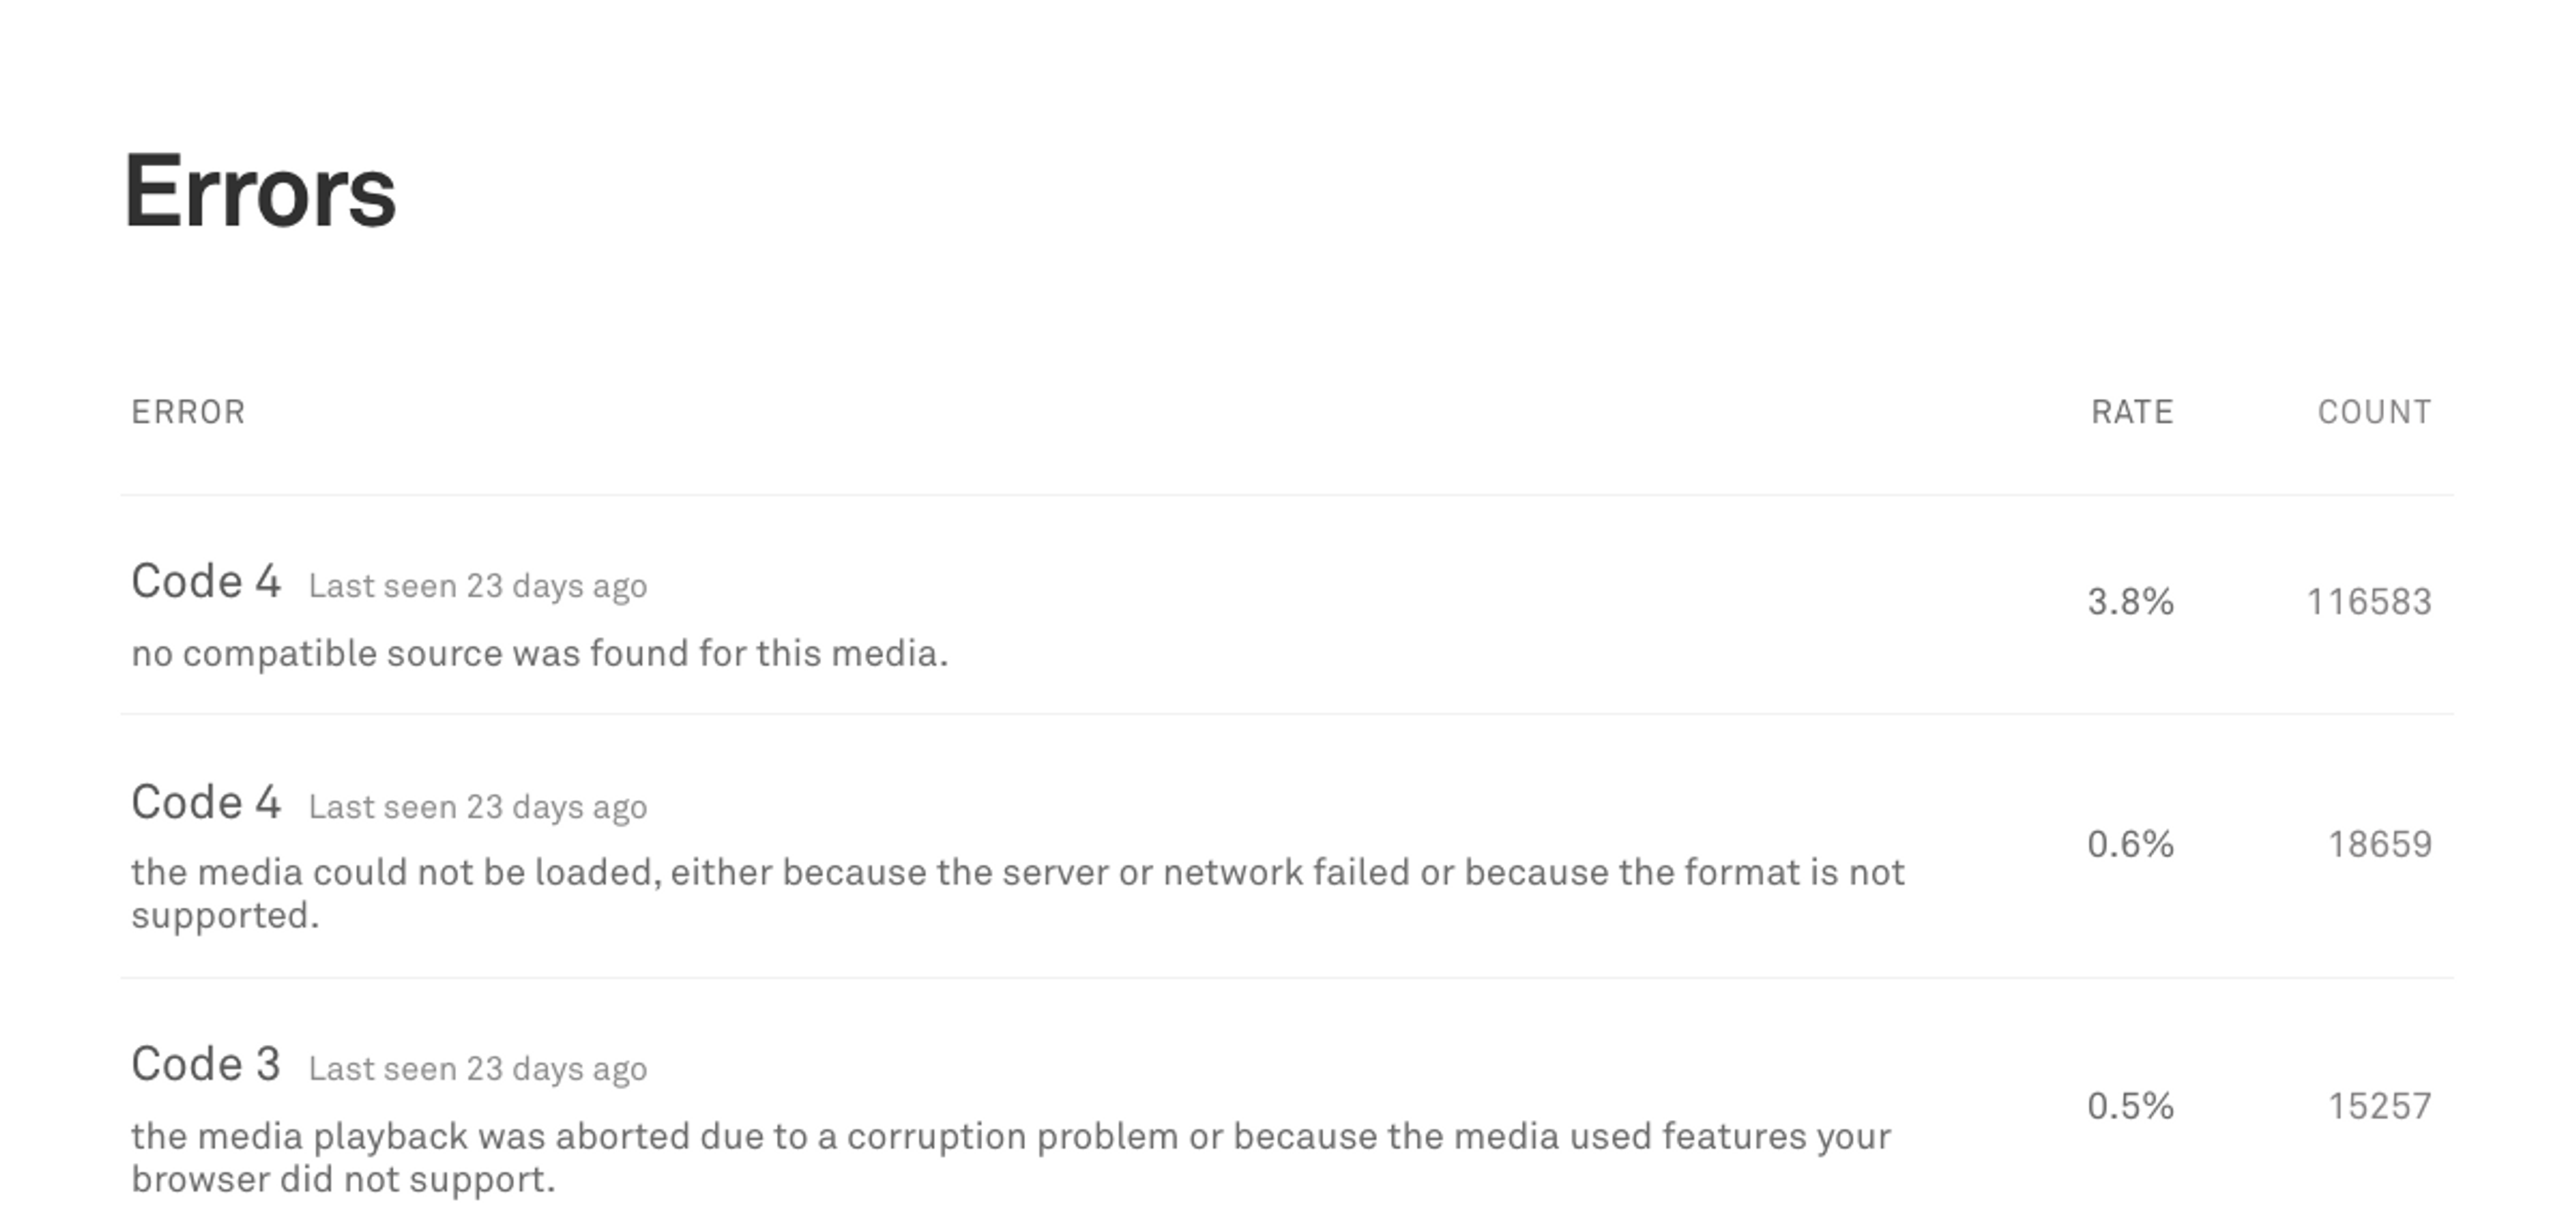
All errors are listed under the Errors tab with descriptions, rates, and error count.
You can read more about each error by clicking on the Error names. This brings up the error message, how many videos were affected, and more.
The Data Dashboard Metrics page
Accessible from the left navigation pane, the Metrics page shows graphs of how your choice of metric has changed over time. If any unusual events have occurred, you can see at a glance how statistically significant they are, and their rate of change.
The Playback Failure Percentage metric shows this graph. You may notice the sharp spike in Playback Failure Percentage at 1pm. Also notice the dotted line, which indicates the Mux Customer average over 90 days.
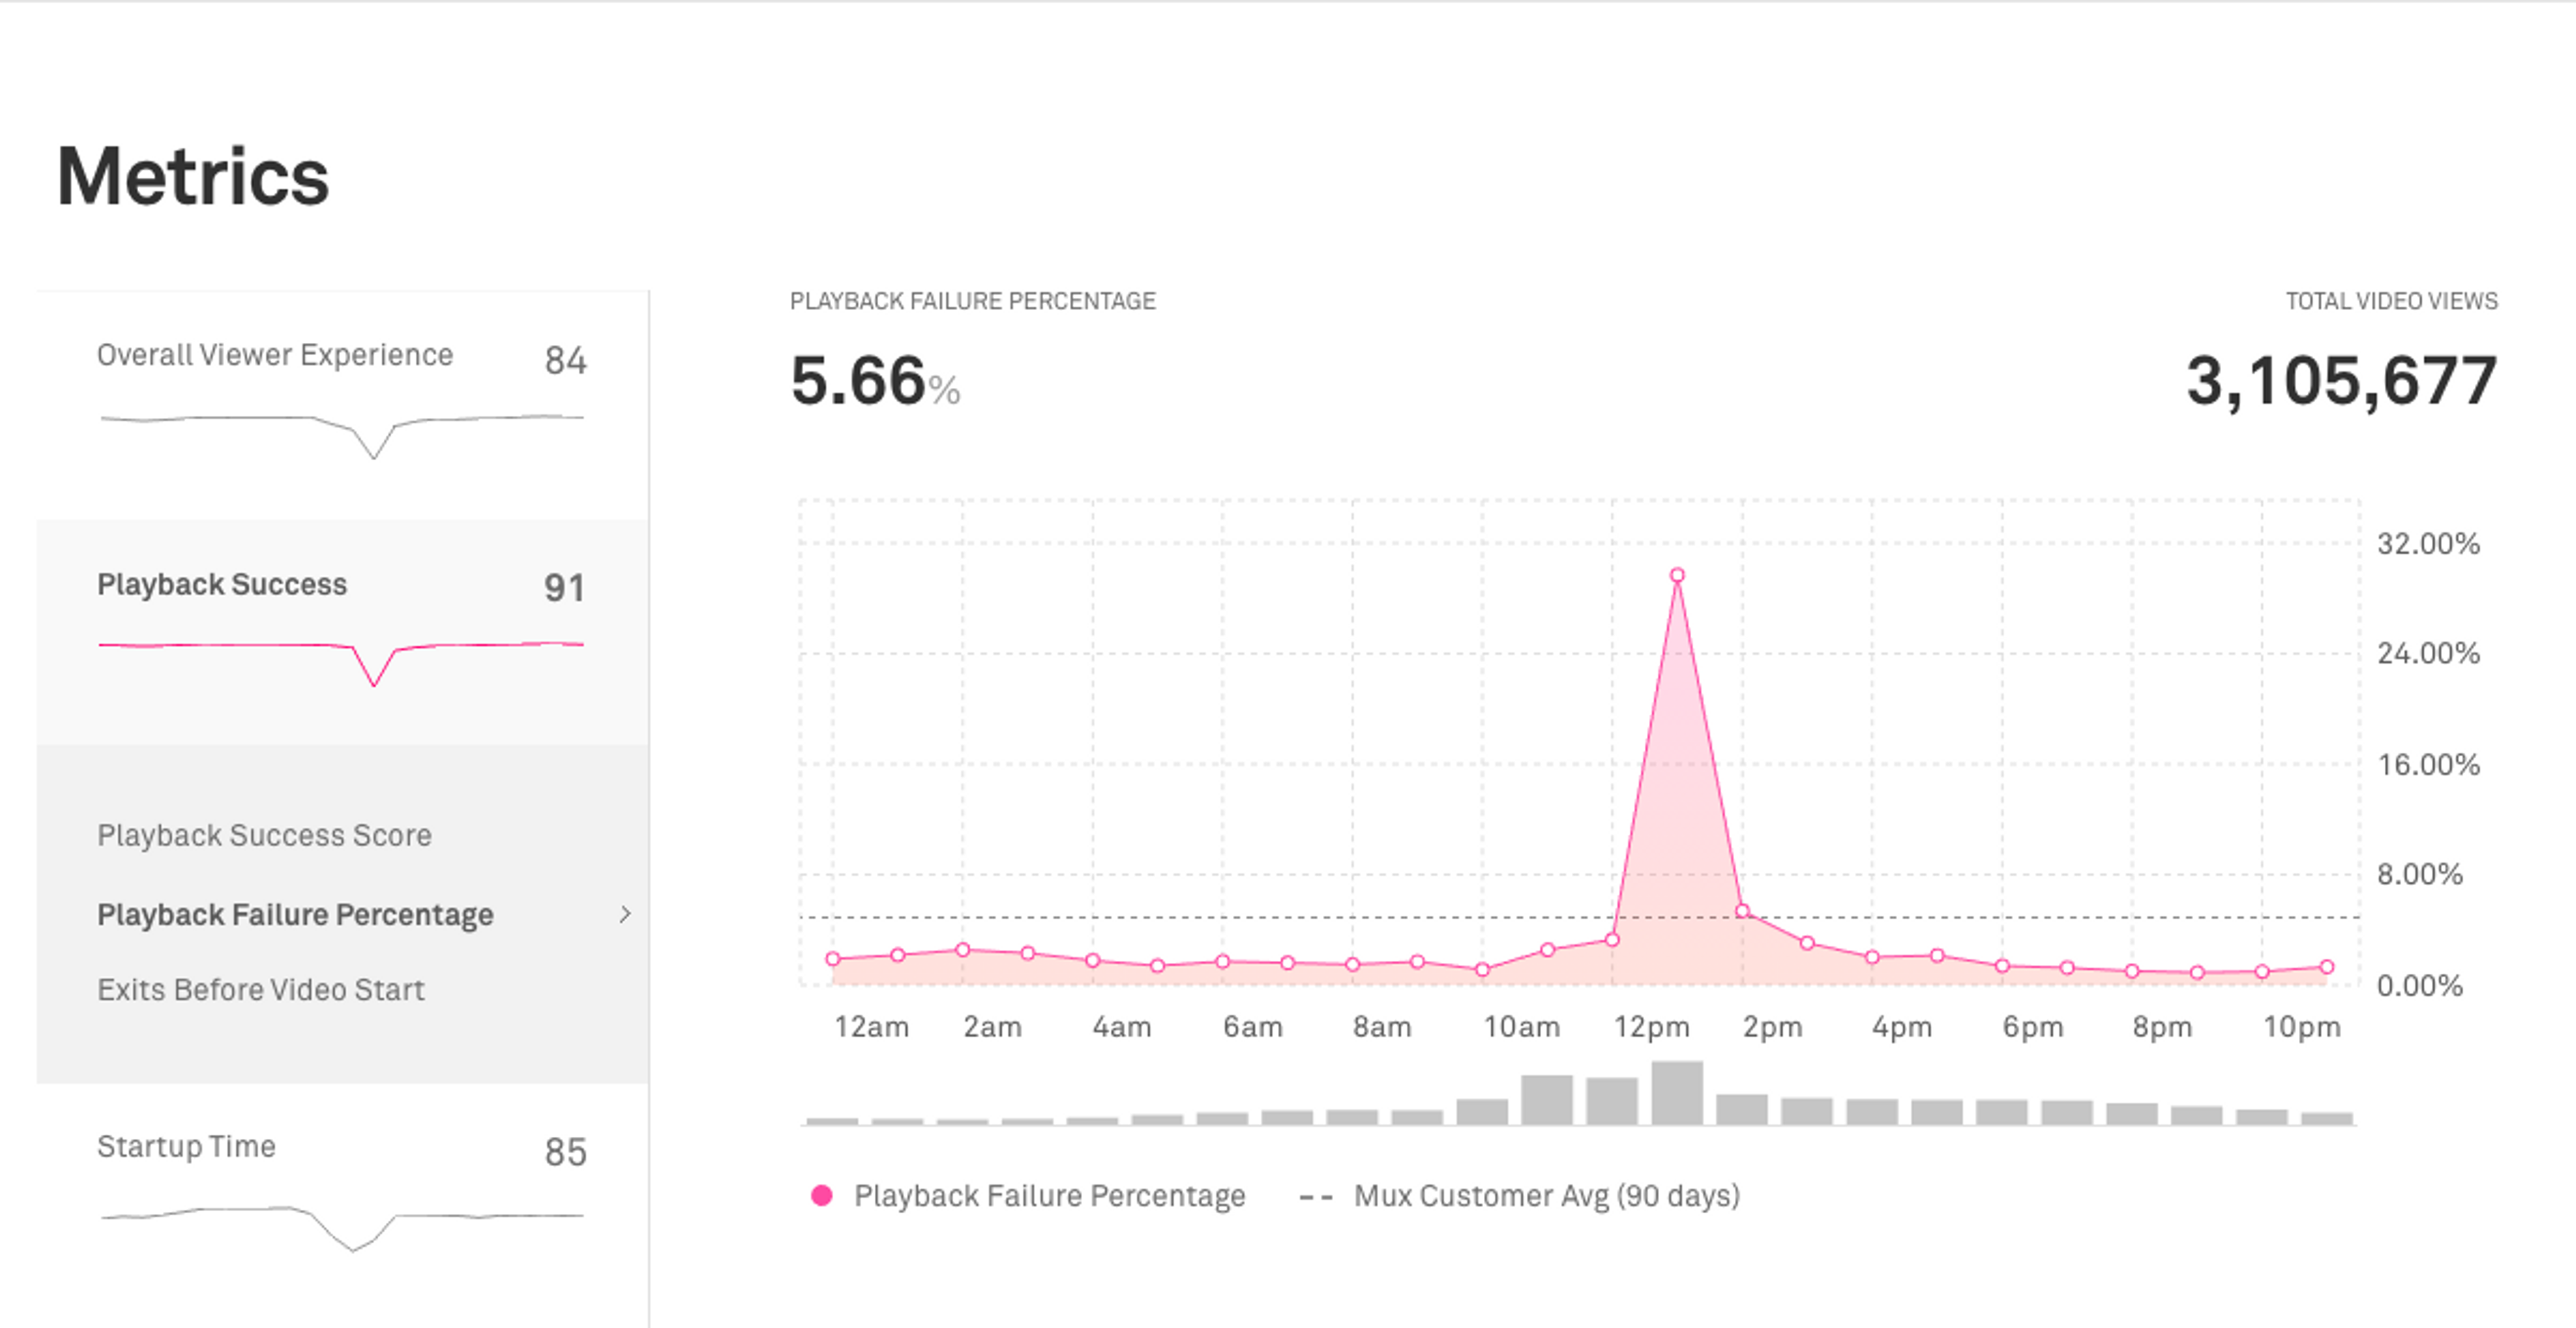
Metrics Description tab: what is Playback Failure Percentage?
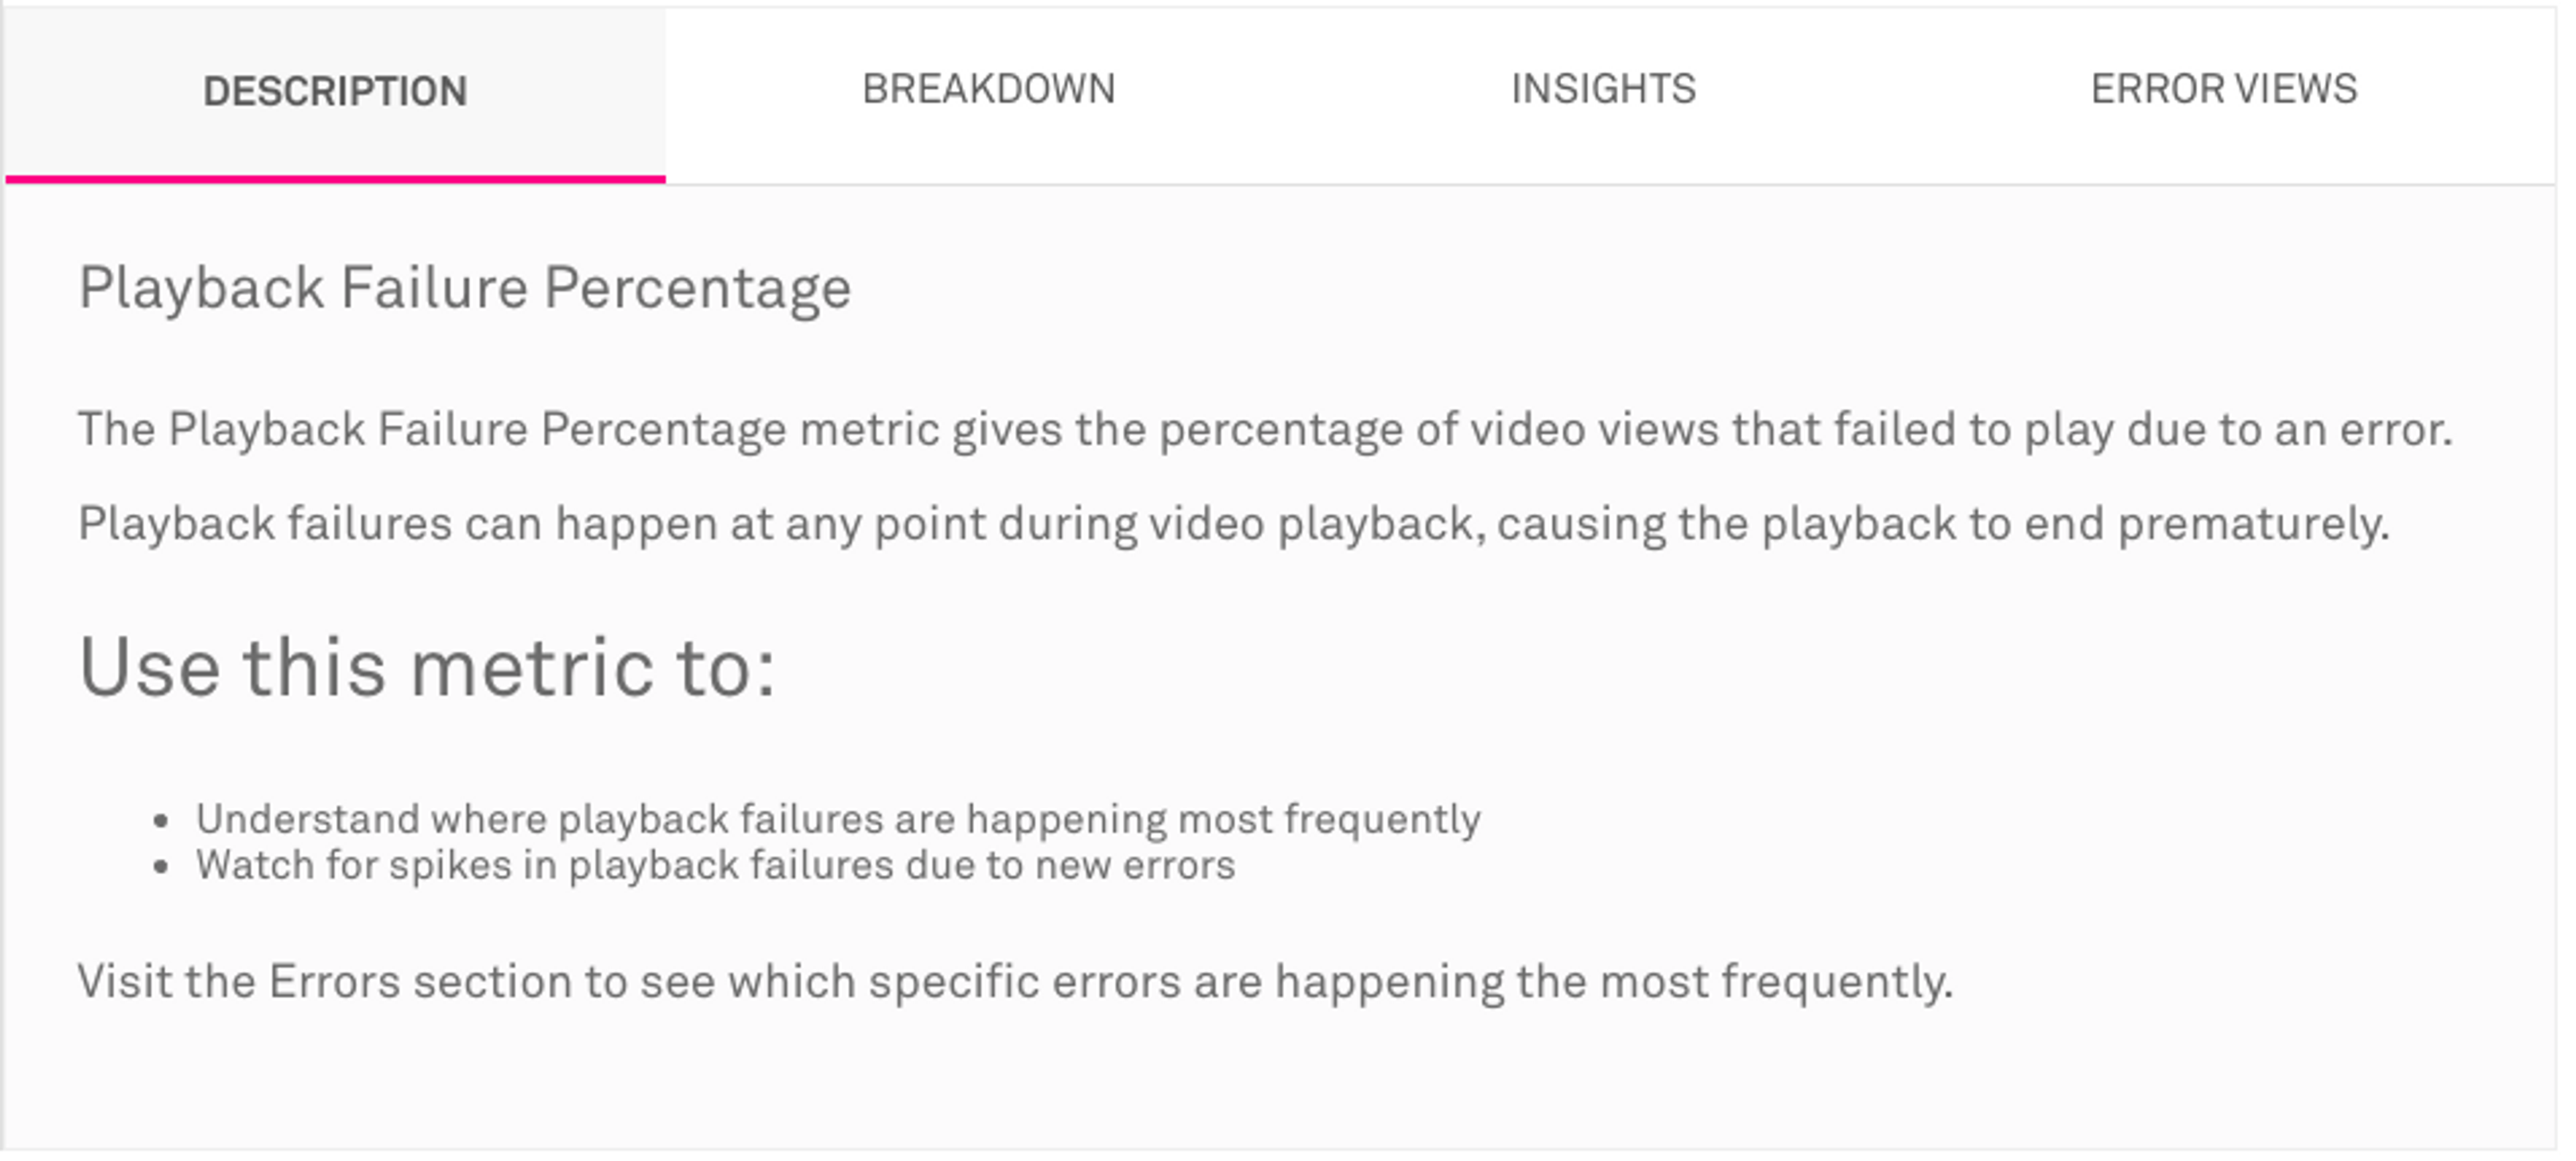
On the Metrics page, the Description tab gives a quick definition of any selected metric. This includes what the metric is used for, and any notes or contributing factors, limitations, and common errors you should be aware of.
For example, here’s the description for Playback Failure Percentage:
If you’re new to video technology, we recommend reading about the various video metrics!
Metrics Breakdown Tab: track even more factors
On the Metrics page, the Breakdown Tab displays a comprehensive report in the panel. This shows a detailed evaluation of all Devices, Players, Video IDs, Stream Types, Networks, Regions, and more. The breakdown provides an in-depth view of many factors that are at play.
For example, in this breakdown by Browser, each browser listed has a rate of Playback Failure Percentage and Total Views. This gives the total Negative Impact score, which is sortable.
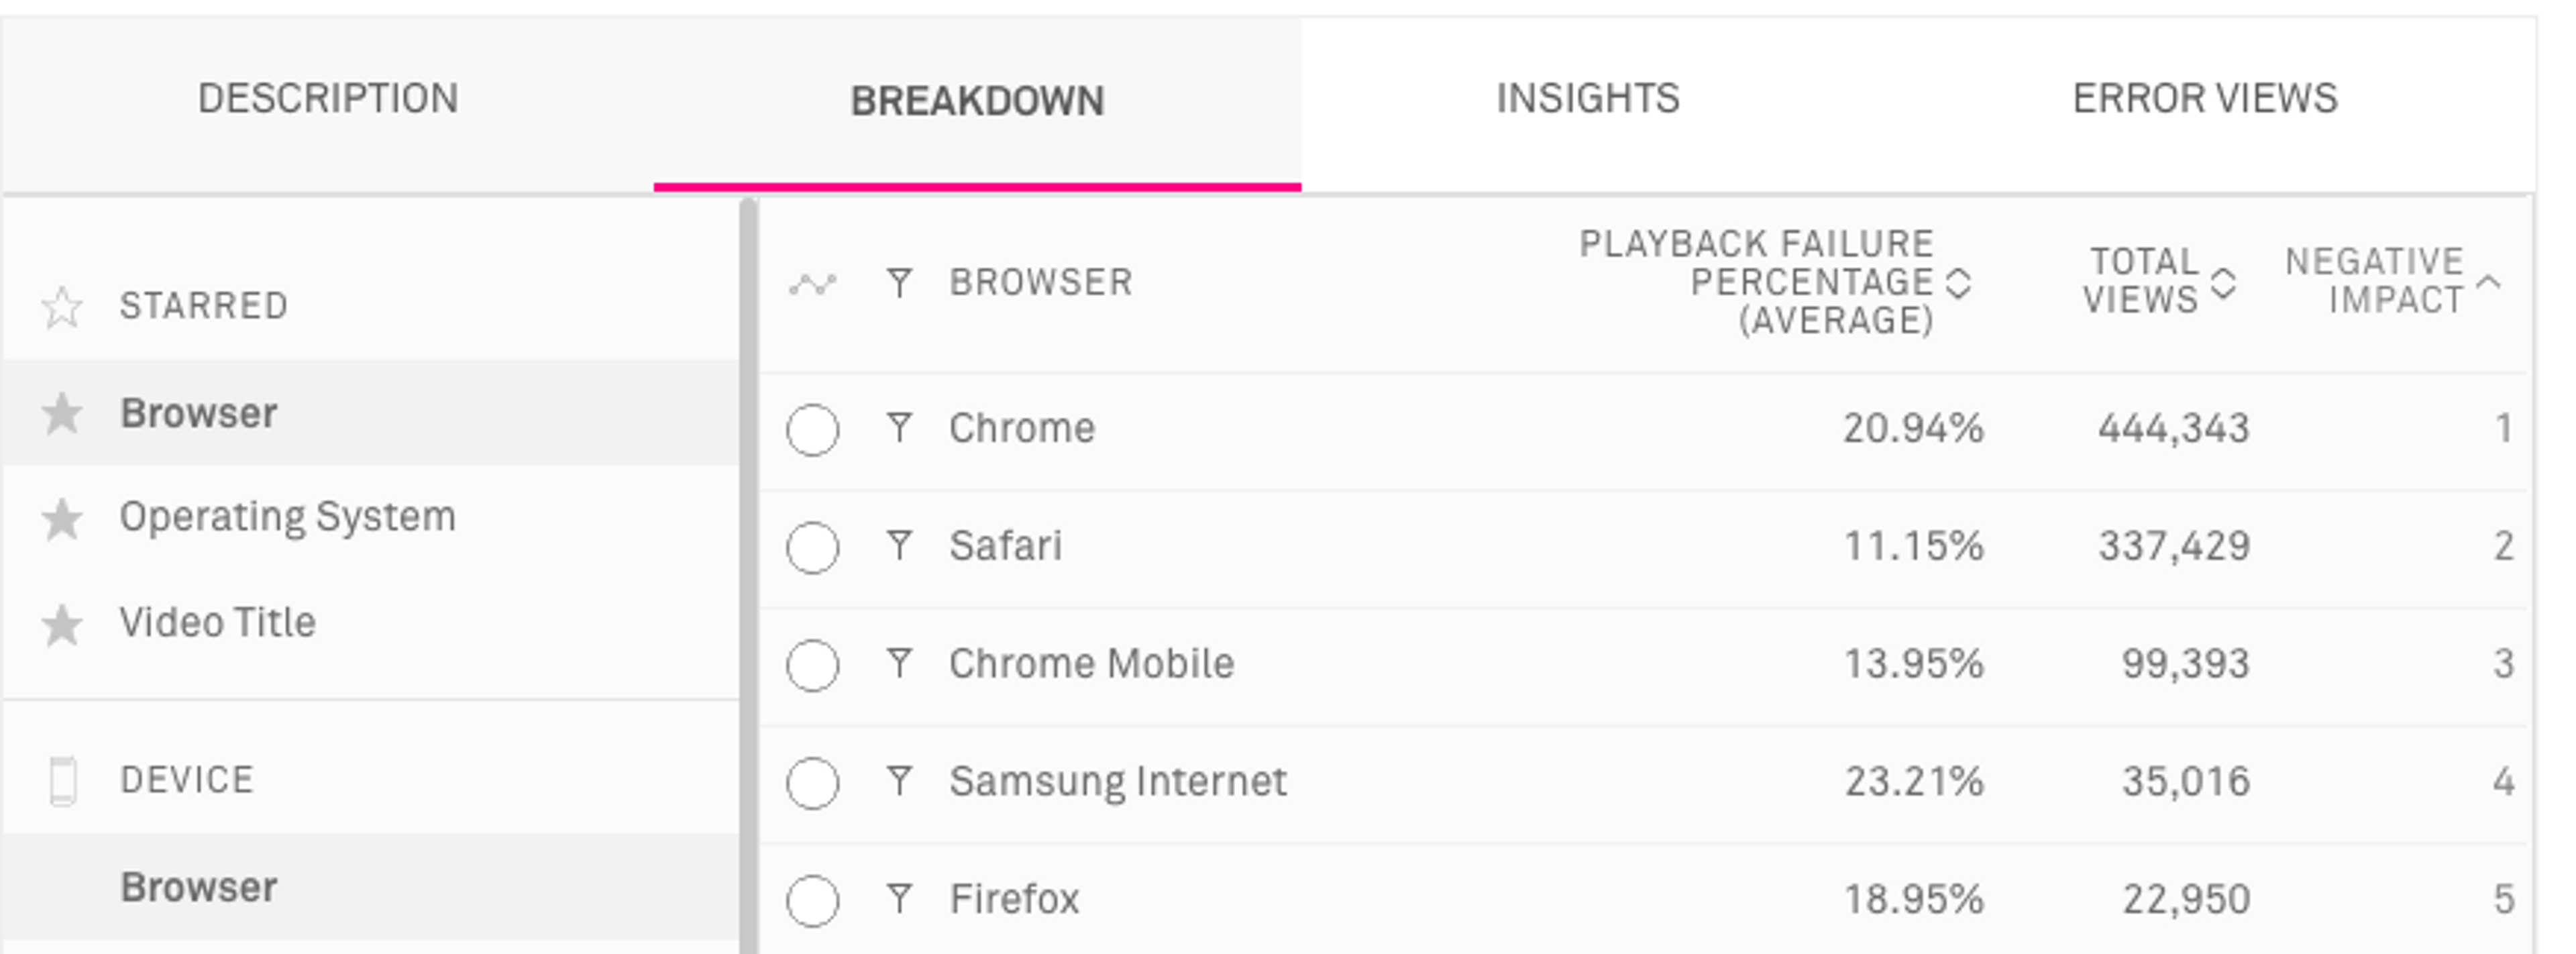
The Breakdown Tab displays a comprehensive report, and can also show how negative impact was calculated.
Metrics Insights tab: what may be causing a key event?
On the Metrics page, the Insights tab lists all key factors with the most impact, according to results from our data mining algorithms. This can help reveal what caused the sudden spike in Playback Failure Percentage.
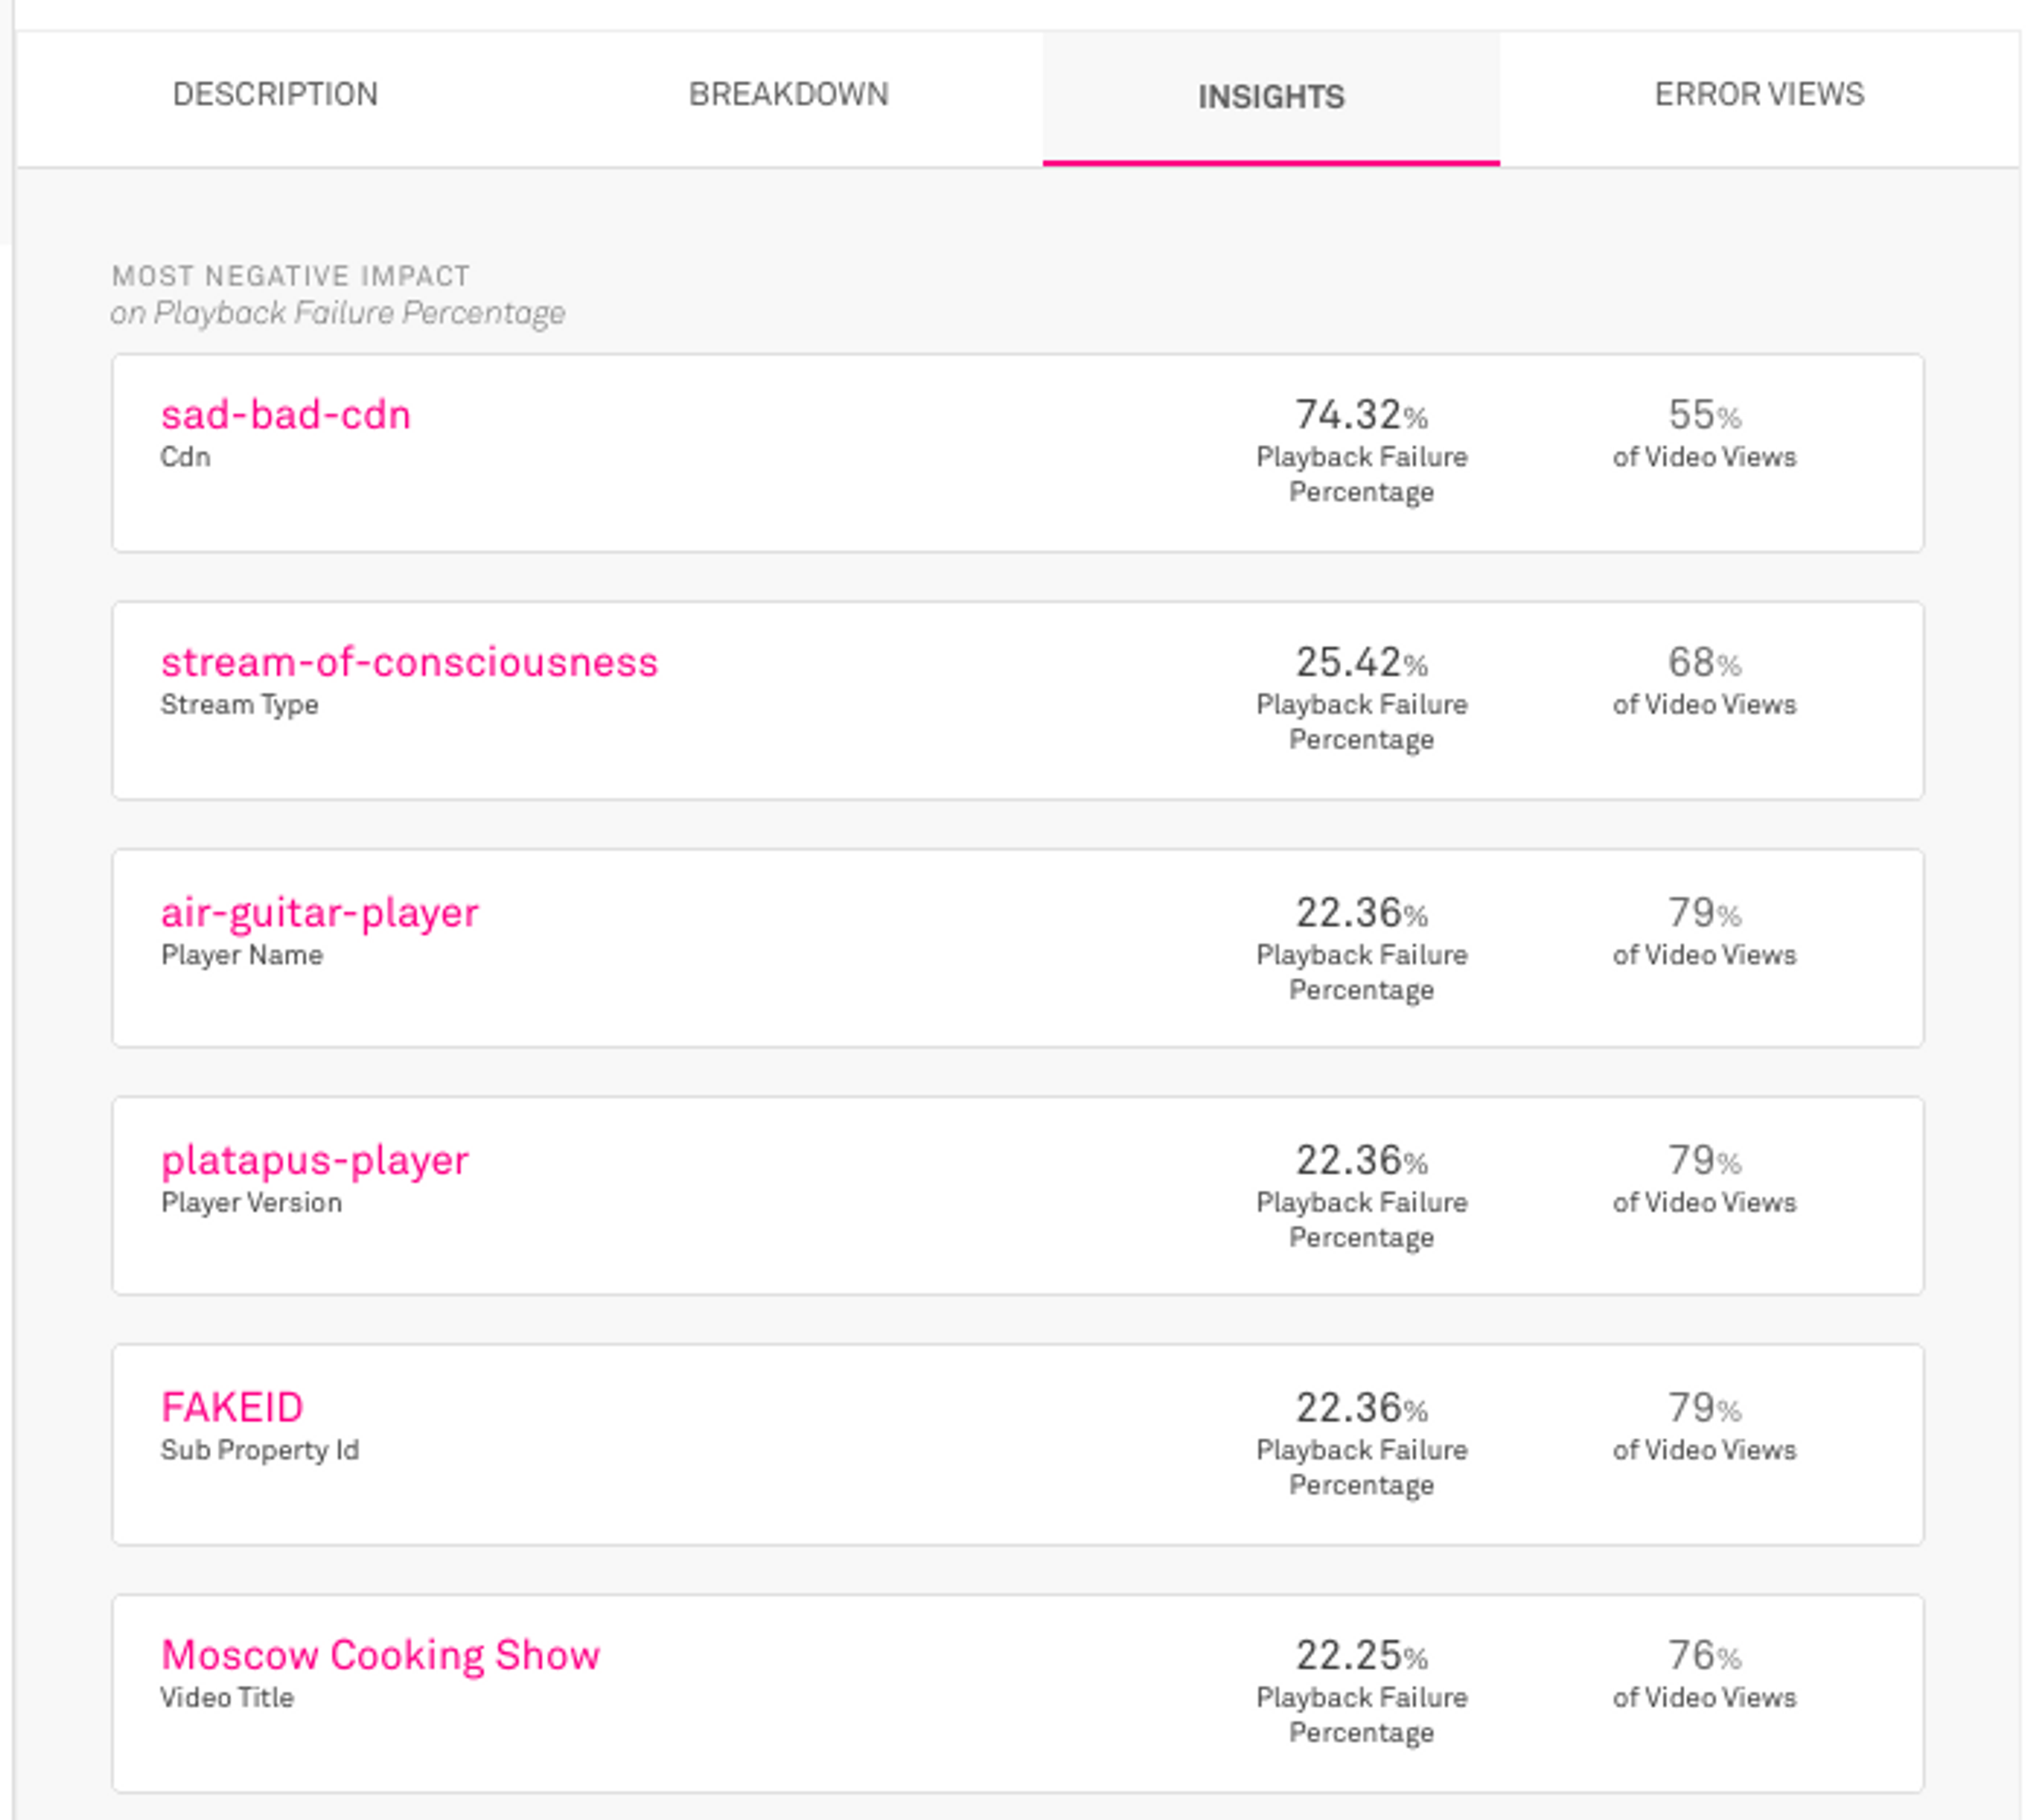
The Insights tab has a list of factors for the selected metric, in order of most negative impact.
In this case, the top insight listed is `sad-bad-cdn`, and this CDN is generating a 74.32% playback failure percentage affecting 55% of video views. A CDN, or Content Delivery Network, is a geographically distributed group of servers that work together to provide fast delivery of Internet content.
Which breakdown can help us learn more about what caused the playback failure spike? Let's generate two data models using the Playback Failure Percentage metric. The raw data is available via the Mux Data API.
Get Metrics data from the Mux Data API
The Mux API is a direct way to interact with the data we store at Mux about your videos, live streams, and metrics. The APIs used to create the Mux Data Dashboard are available directly to you so that you can build your own custom dashboards. The Mux Data API Documentation offers a more detailed set of options and guides, including all available endpoints.
For this example, make an HTTP request to two distinct API endpoints using the metric playback_failure_percentage. For other trends and events, you can use different API endpoints. All successful HTTP requests to the API return a response, formatted as JavaScript objects in JSON format. This Javascript object data structure is human-readable, and follows RESTful concepts including error codes, metadata, and headers.
To make authenticated HTTP requests to the Mux API endpoints directly from the command line, you can use cURL, or if you prefer a GUI, applications like Postman and Insomnia are also an option.
First, store the credentials inside environment variablesm, then make a request at the List Breakdown Values endpoint, by copying the endpoint URI and specifying the metric_id as playback_failure_percentage and the group_by value as cdn:
GET https://api.mux.com/data/v1/metrics/playback_failure_percentage/breakdown?group_by=cdn
The API returns a response in this format:
{
    "total_row_count": 8,
    "timeframe": [
        1608930026,
        1609016426
    ],
    "data": [
        {
            "views": 158,
            "value": 15.822784810126583,
            "total_watch_time": 194408859,
            "negative_impact": 4,
            "field": "g-cdn"
        },
        {
            "views": 6,
            "value": 0,
            "total_watch_time": 4023694,
            "negative_impact": 6,
            "field": "f-cdn"
        },
		...
}
In the response object, note that the data key includes an array with an object for every CDN name. Each array object has a field key that represents the CDN name, a value key that represents the playback_failure_percentage value, a views key that represents the total number of views, and a few more. These data values will be used to plot the chart. Save this response to a file named playback_failure_cdn.json.
Make a request at the Get Metric Timeseries Data endpoint. To do this, copy the endpoint URI and specify the metric_id as playback_failure_percentage:
GET https://api.mux.com/data/v1/realtime/metrics/playback-failure-percentage/timeserie
The API returns a response in this format:
{
    "total_row_count": 11,
    "timeframe": [
        1608163645,
        1608165440
    ],
    "data": [
        {
            "value": 6.068530207394047,
            "date": "7:25",
            "concurrent_viewers": 1545
        },
        {
            "value": 7.68530207394047,
            "date": "8:25",
            "concurrent_viewers": 333
        },
		...
}
In the response object, note that the data key contains an array with an object for every date or datetime value. Each array object contains a value key which represents the playback_failure_percentage, a date key which represents the timestamp for each value, and a concurrent_viewers key which represents the total viewers. These data values will be used to plot the chart. Save this response to a file named playback_failure_timeseries.json.
In the next step, use these data objects to plot two graphs: playback failure percentage by CDN and playback failure percentage over time.
Create a React application
Create-React-App is an easy way to build and set up a React app without any configuration.
Following the Quick Start, set up a new React application in your local directory. Run the app in development mode with these commands, and view it in the browser at http://localhost:3000.
$ npx create-react-app my-app
$ cd my-app
$ npm start
To adapt the template, open the project in a text editor to make some changes in the src directory:
- In App.js, delete formatting in CSS files, default headers, and logo.svg.
- Add the JSON response files, playback_failure_cdn.json and playback_failure_timeseries.json
Plot graphs using Recharts graph components
Next, create two graphs in the React app. At Mux, we use the Recharts React library to generate graphs about Mux Video data metrics.
Follow this guide to install Recharts and choose an appropriate chart from this library of examples. In each example, the sample code data object has a similar structure to the Data API JSON response data. These templates are easy to adapt and use.
In the project src directory, create two copies of the BrushBarChart component for each of the graphs named BrushBarChart and BrushBarChart2. They're essentially the same but have different metrics set to their x-axis and y-axis.
- In BrushBarChart the dataKeys are date, value, and concurrent_viewers.
- In BrushBarChart2 the dataKeys are field, negative_impact and total_watch_time.
- Pass props to data from the parent like this: data={this.props.data}
Once complete, here is what one chart component looks like:
import React, { PureComponent } from 'react';
import {
  BarChart, Bar, Brush, ReferenceLine, XAxis, YAxis, CartesianGrid, Tooltip, Legend,
} from 'recharts';

export default class BrushBarChart extends PureComponent {
  static jsfiddleUrl = 'https://jsfiddle.net/alidingling/mc8r7e6p/';

  render() {
    return (
        <BarChart
            width={900}
            height={300}
            data={this.props.data}
            margin={{
                top: 5, right: 30, left: 20, bottom: 5,
            }}
            >
            <CartesianGrid strokeDasharray="3 3" />
            <XAxis dataKey="date" />
            <XAxis dataKey="date" padding={{ left: 30, right: 30 }} />
            <YAxis />
            <Tooltip />
            <Legend verticalAlign="top" wrapperStyle={{ lineHeight: '40px' }} />
            <ReferenceLine y={0} stroke="#000" />
            <Brush dataKey="date" height={30} stroke="#8884d8" />
            <Bar dataKey="value" fill="#8884d8" />
            <Bar dataKey="concurrent_viewers" fill="#82ca9d" />
        </BarChart>
    );
  }
}
Finally, import all files into App.js, and edit the ReactDOM.render method to include two graph components. Use the data property object with dot notation to pass the two datasets to each respective component (data={playback_failure_cdn.data}).
import React from "react";
import "./styles.css";
import playback_failure_cdn from "./playback_failure_cdn.json";
import playback_failure_timeseries from "./playback_failure_timeseries.json";
import BrushBarChart1 from "./BrushBarChart1";
import BrushBarChart2 from "./BrushBarChart2";

export default function App() {
  return (
    <div className="App">
      <header className="App-header">
        <h1>Mux Data API + Recharts Demo</h1>
        <p>
          Using mock data from the Mux Data API, generate two React charts.
        </p>
        <i>by Olivia Smith (Support Engineer @ Mux)</i>
        <p>Resources:</p>
        <a
          className="App-link"
          href="https://mux.com/data"
          target="_blank"
          rel="noopener noreferrer"
        >
          Mux Data
        </a>
        <a
          className="App-link"
          href="https://api-docs.mux.com/"
          target="_blank"
          rel="noopener noreferrer"
        >
          Mux Data API
        </a>
      </header>
      <body>
        <h1>Video Playback Failure Percentage by CDN</h1>
        This graph visualizes the response from the Metrics Breakdown endpoint,
        grouped by the CDN name. The x-axis represents the CDN name, and the
        y-axis represents playback failure percentage.
        <BrushBarChart1 data={playback_failure_cdn.data} />
        <h1>Video Playback Failure Percentage over Time</h1>
        This graph visualizes the response from the Metrics Timeseries endpoint.
        The x-axis represents time and the y-axis represents the playback
        failure percentage value in purple and concurrent viewers in green.
        <BrushBarChart2 data={playback_failure_timeseries.data} />
      </body>
    </div>
  );
}
Re-render the page and see the two animated graphs appear.
Graphs and results
Playback Failure By CDN Graph
View Playback Failure Percentage graphs and live code here on Codesandbox
View this video of the Playback Failure by CDN Graph created on stream.new
This graph visualizes the response from the Metrics Breakdown endpoint, grouped by the CDN name. The x-axis represents the CDN name, and the y-axis represents playback failure percentage.
Playback Failure Percentage over Time Graph
View Playback Failure Percentage graphs and live code here on Codesandbox
View this video of the Playback Failure Percentage graph created on stream.new
This graph visualizes the response from the Metrics Timeseries endpoint. The x-axis represents time and the y-axis represents the playback failure percentage value in purple and concurrent viewers in green. In this demonstration, the data aligns with the critical event at 1:05pm.
Conclusion
Mux Data uses thorough metrics and powerful filtering tools to find what users are seeing across devices and locations. The Mux Data API helps you access the raw data that these metrics were created from. This data can be used to generate deeper insights beyond the Mux Data Dashboard, and capture details to develop complex analytical trends and models. Mux Data can empower your team to optimize the performance of your videos, and provide lightning-fast streaming to your audience.
The possibilities are endless for customizing charts using React components from the Rechart Library. You can use these visuals to illustrate the performance of videos however you want - either internally, on a website, email campaign, or blog post like this.
If you create something from this guide or find it helpful in any way, please reach out! We’re always interested in hearing from customers about their experience using Mux.


