We recently redesigned our aggregate metric charts and decided to take another look at how we help customers make sense of individual video views.
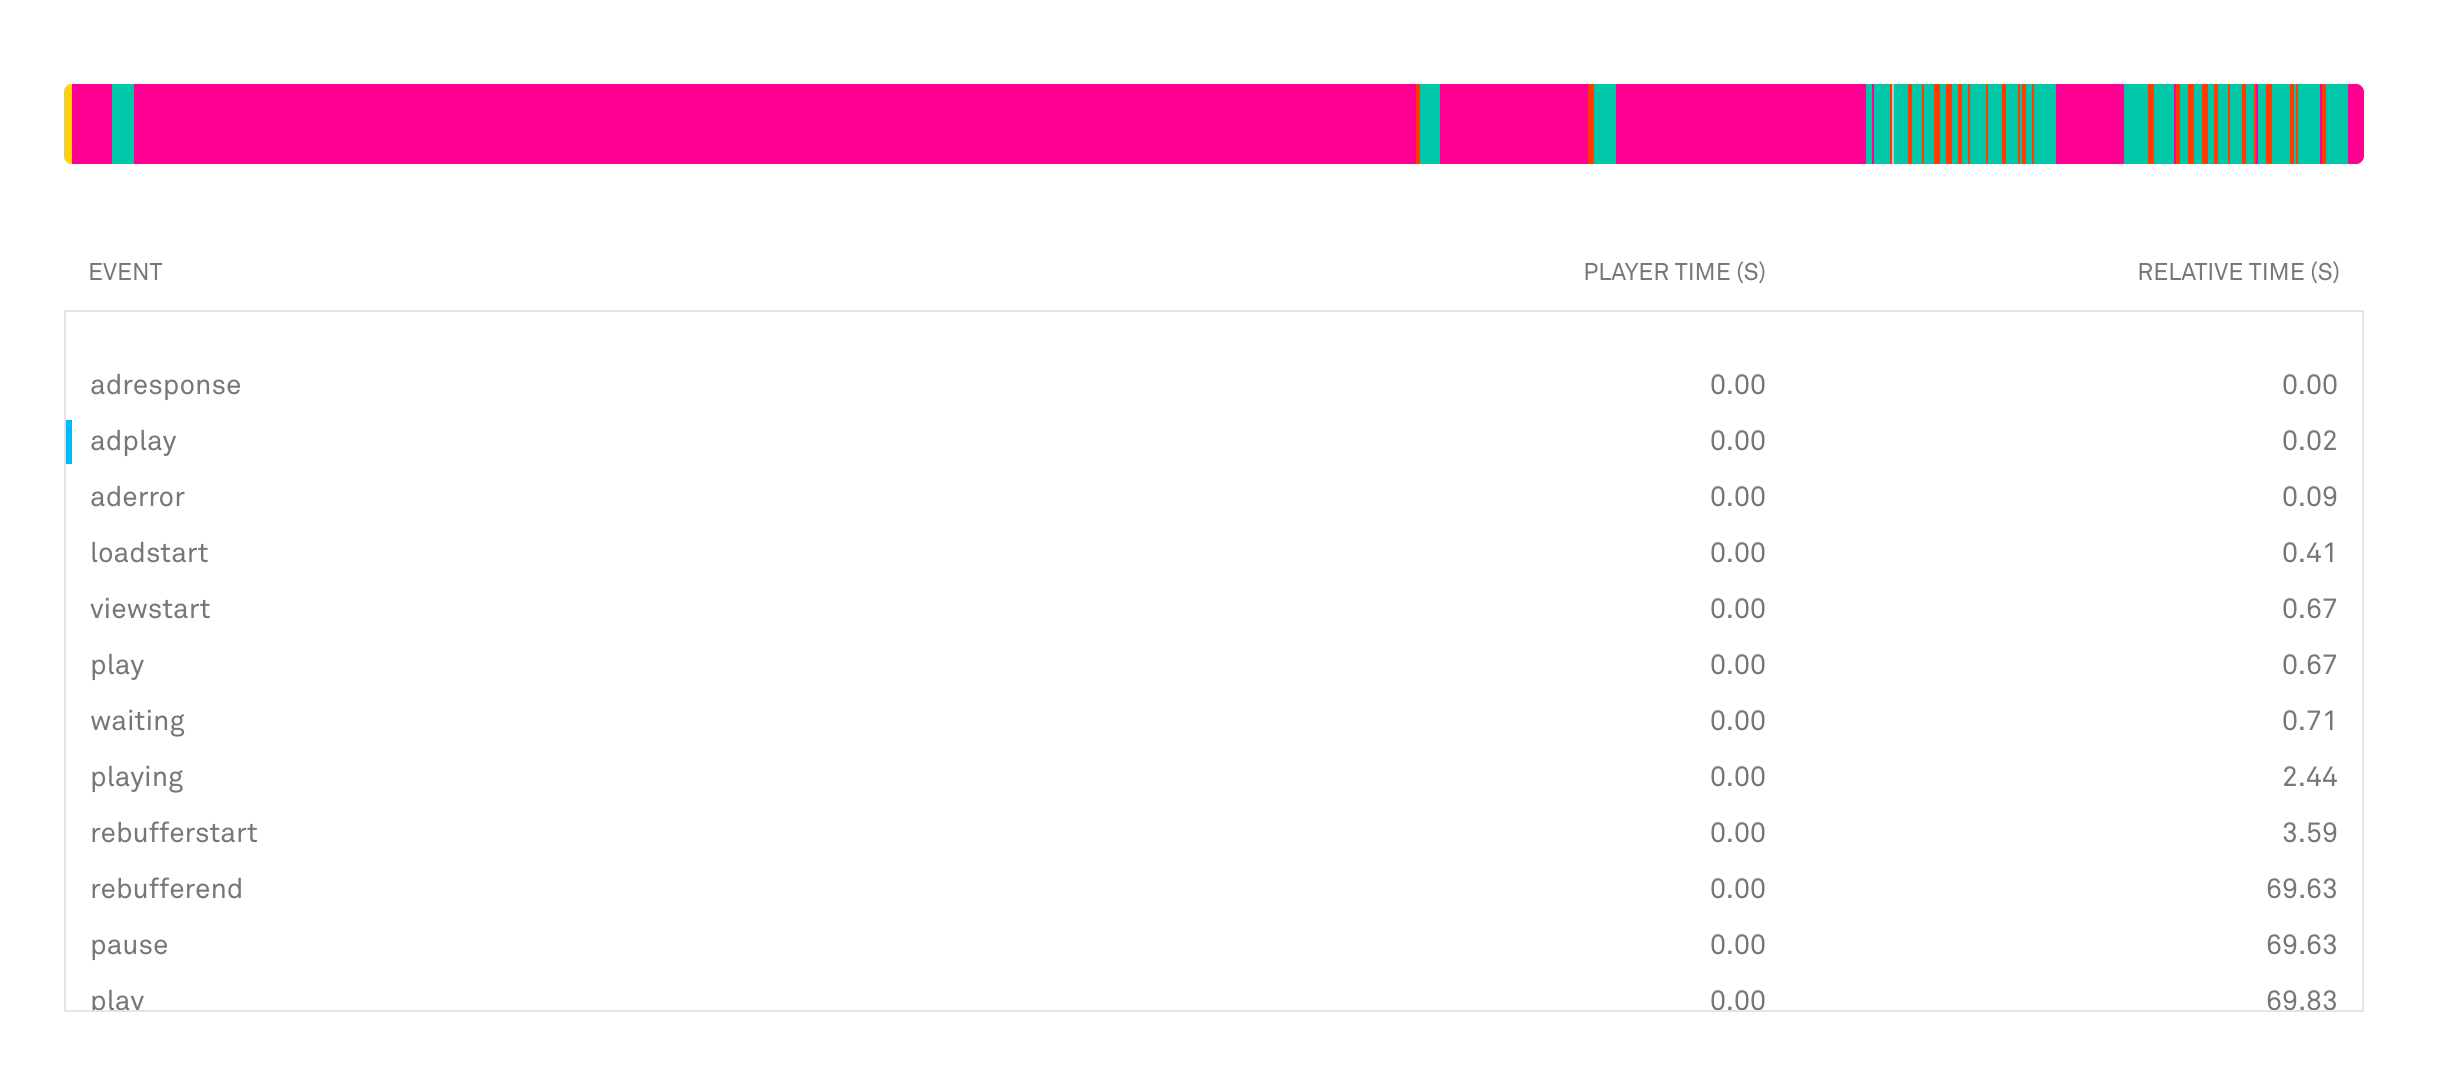
Previously, the top portion of our video view page broke down each recorded event into a list of events, which corresponded to a section of color in the timeline.
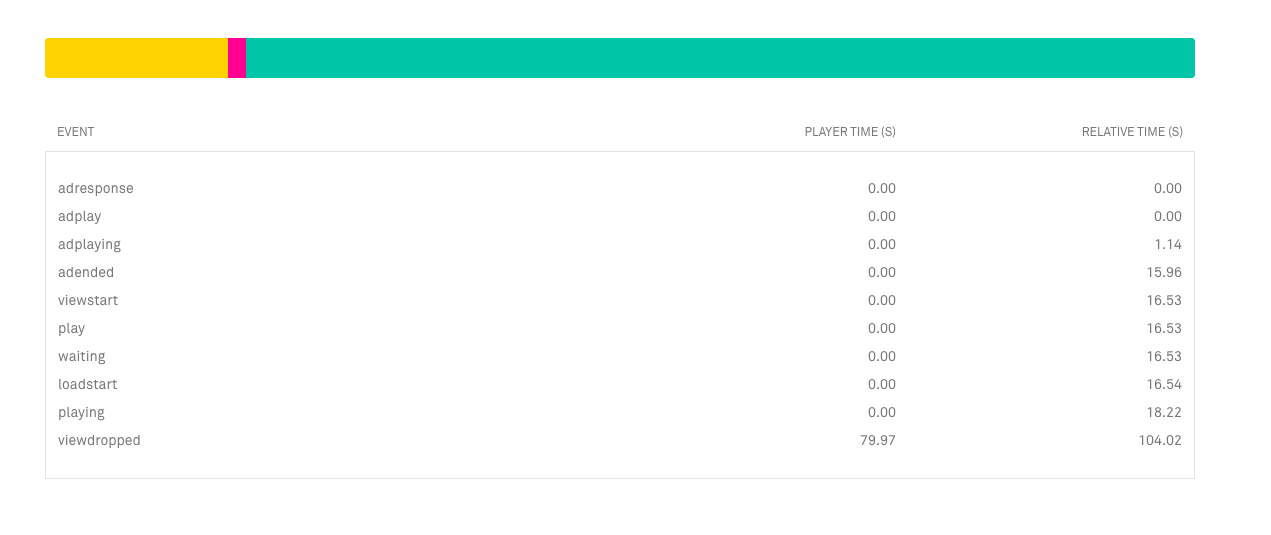
While this worked reasonably well and gave a visual insight into what events happened in the course of a video playback, we could see room for improvement on the design and UX side of things.
For example, the events in the event log are associated with bars in the chart, but that is not immediately clear until you hover over an item in the event log. Furthermore, the colors represent types of events, but it isn’t exactly obvious what those event types are since there is no legend available and hot pink isn’t the first color that comes to mind when thinking about rebuffering.
Confusing chart associations and bad color schemes aside, what happens when you have a bunch of different events occur one after the other? In our previous implementation, you would see a bunch of alternating colors resembling a barcode. If you didn’t pay close attention to the event log, you could miss a detail or two. Was there a pause event? Did a rebuffer occur? When and for how long did the video seek? Finding out the answer to those questions all required a close look at the event log.
Legends are key
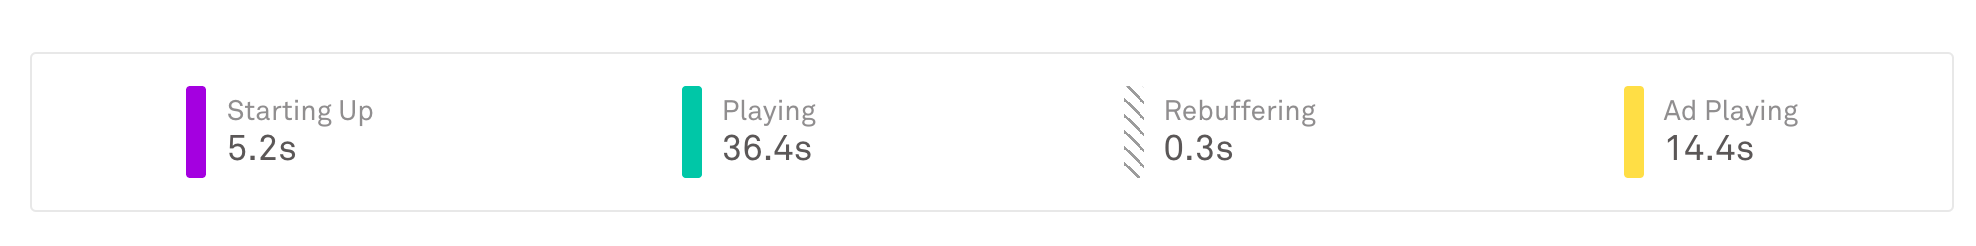
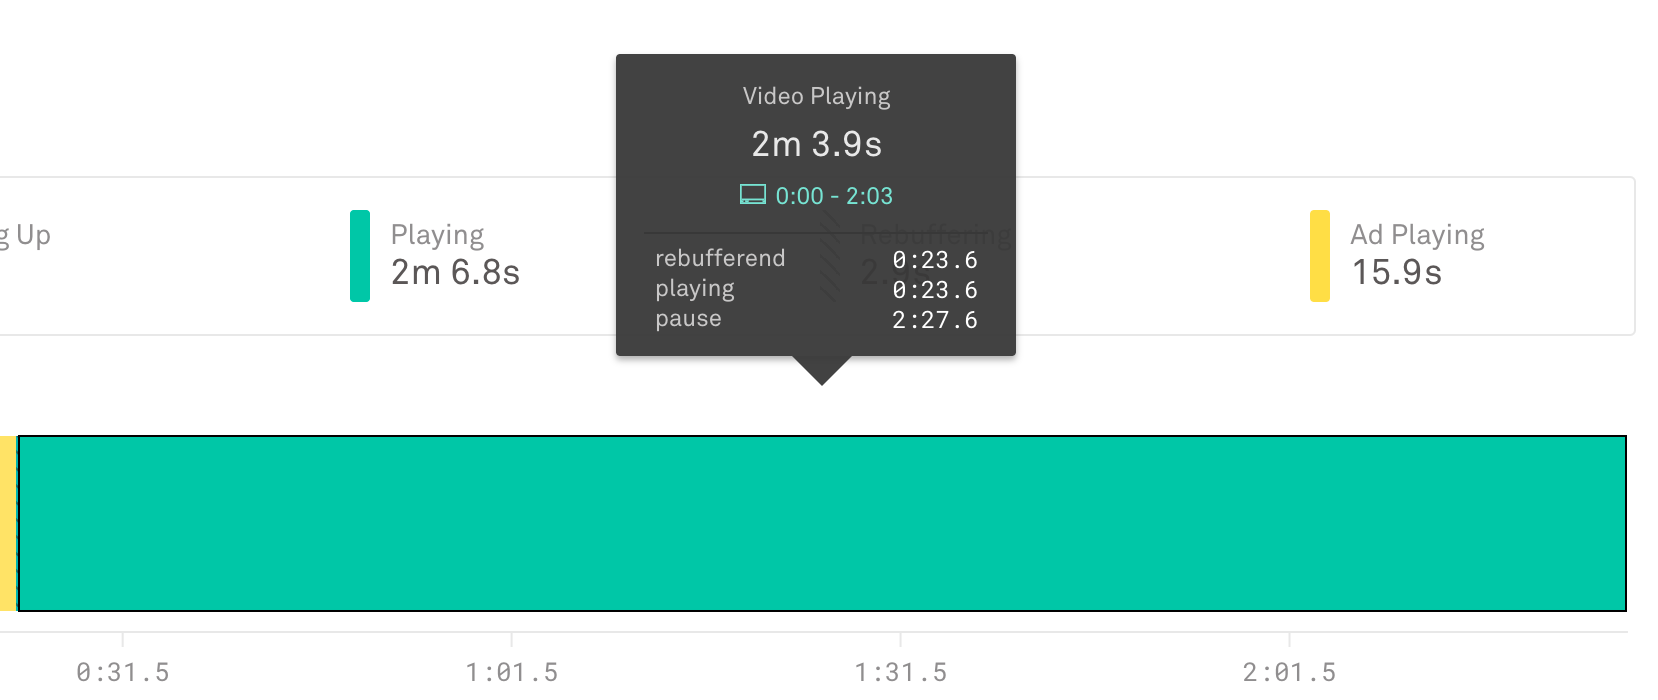
We’ve combined the events we chart into four categories: Starting Up, Playing, Rebuffering, and Ad Playing. These are now in a clear legend representing each category’s color and aggregate duration.
Timelines should display time
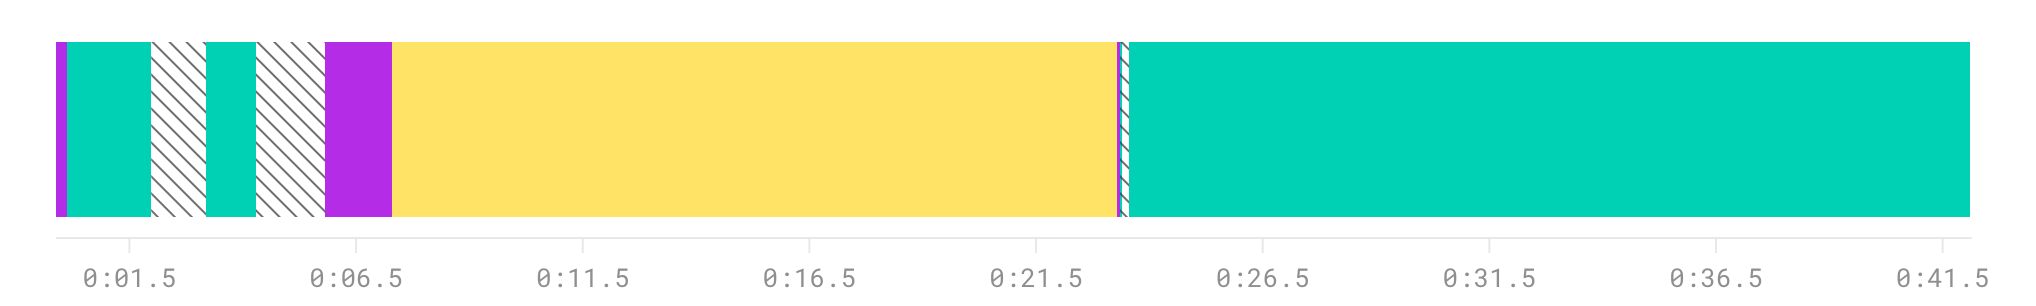
Now we don’t make you look at the event log to figure out when an event in the chart has taken place. An x-axis has been added to indicate where events are in the video playback timeline.
Error events need to be actionable
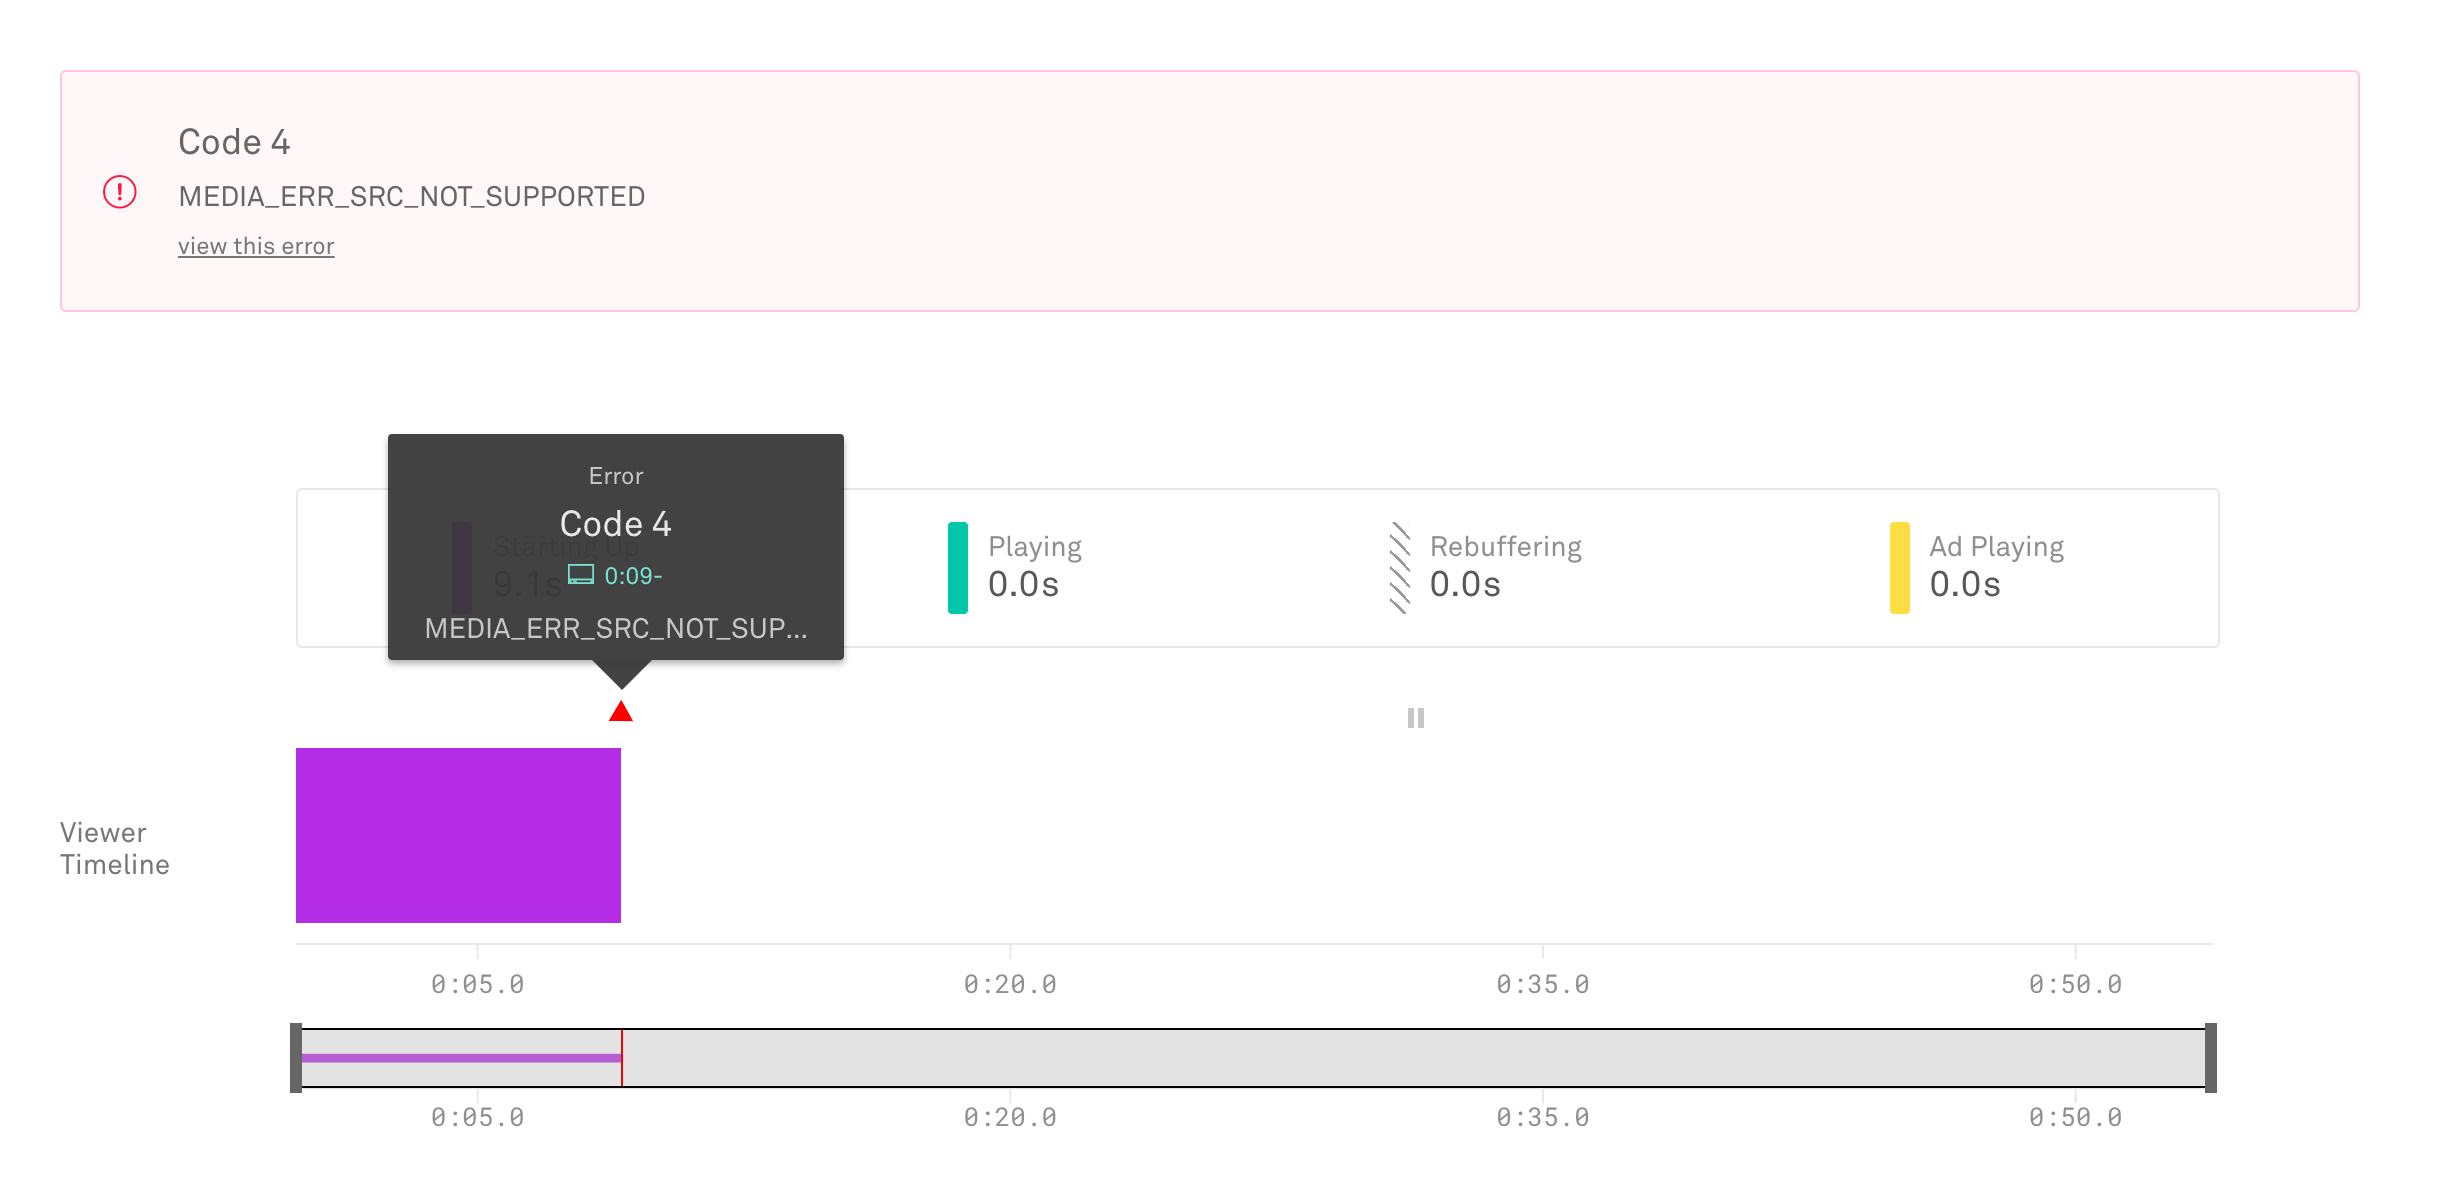
Identifying problems in a system is one of the main use cases for any analytics based product. While we are currently working on further improving our error metrics, we saw the opportunity to increase the actionability of errors seen in an individual video view with information that is available to us today.
You can now link to a specific error that has occurred in a video view. A triangle symbol on the top of the chart will mark where and when it happened.
Visualizations are better with information
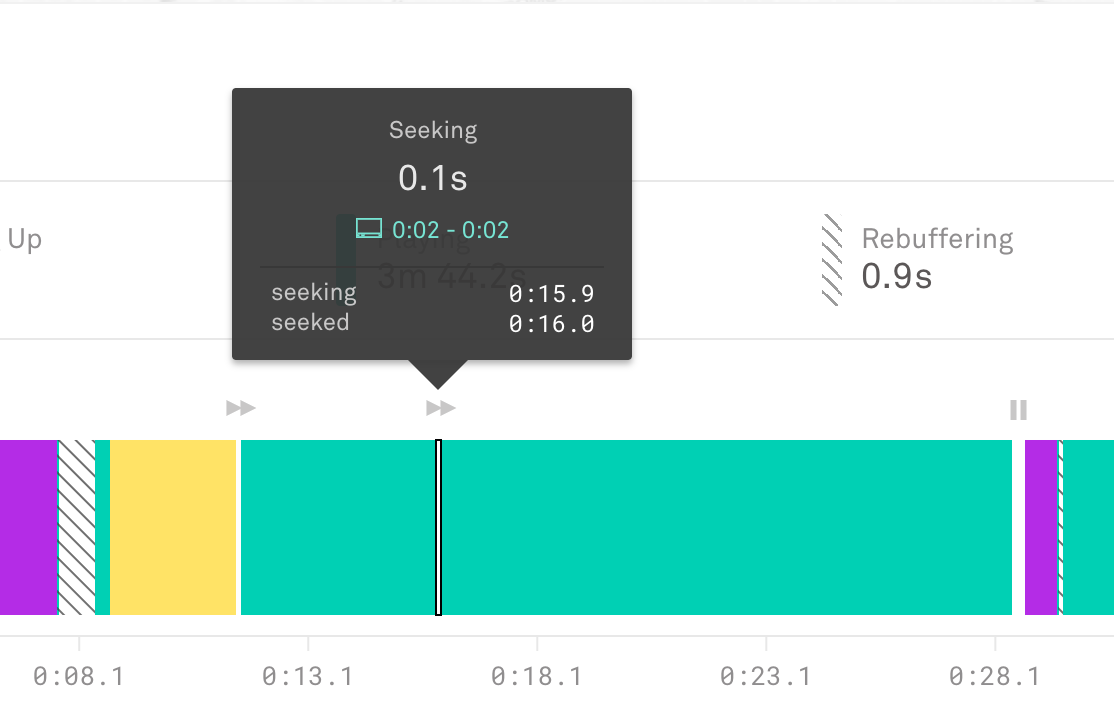
Hovering over a bar in the chart will display its event category type, duration, and playback time. Also included is a list of events that make up the event category block. The first event listed is the start event, and the last ends the current event category block.
Separate event types should be marked clearly
We wanted to mark user initiated events such as pause and seek explicitly on the chart since they can explain non-user initiated event behavior on the timeline. For example, the video timeline may contain a high amount of startup events, but that may be caused by a user seeking or pausing frequently.
Seeking and pause event category blocks are now marked with symbols above the main chart timeline.
Zoom into the details
We added the ability to zoom and pan on any area of the chart to make it easier to see details when many different events happen in close proximity. You can zoom through mouse scrolling on the chart itself or by the brush element below the main chart timeline.
These UX improvements are the first of many to come to the individual view page, and we hope it provides better insight and actionability. As always, if you have any comments or questions, please let us know. We’d love to hear how this is used in the wild.
Many thanks to Steven Striegel and Steve Heffernan for these UX improvements and designing a feature that was a blast to work on. Stay tuned for a follow-up blog post on the technical implementation.