Faster, more scalable video data
Data is the foundation of great video experiences. With just a few lines of code, you’ll get the data you need at world-leading scale so you can understand streaming analytics, monitor user engagement, and improve the quality of experience (QoE) for your viewers.
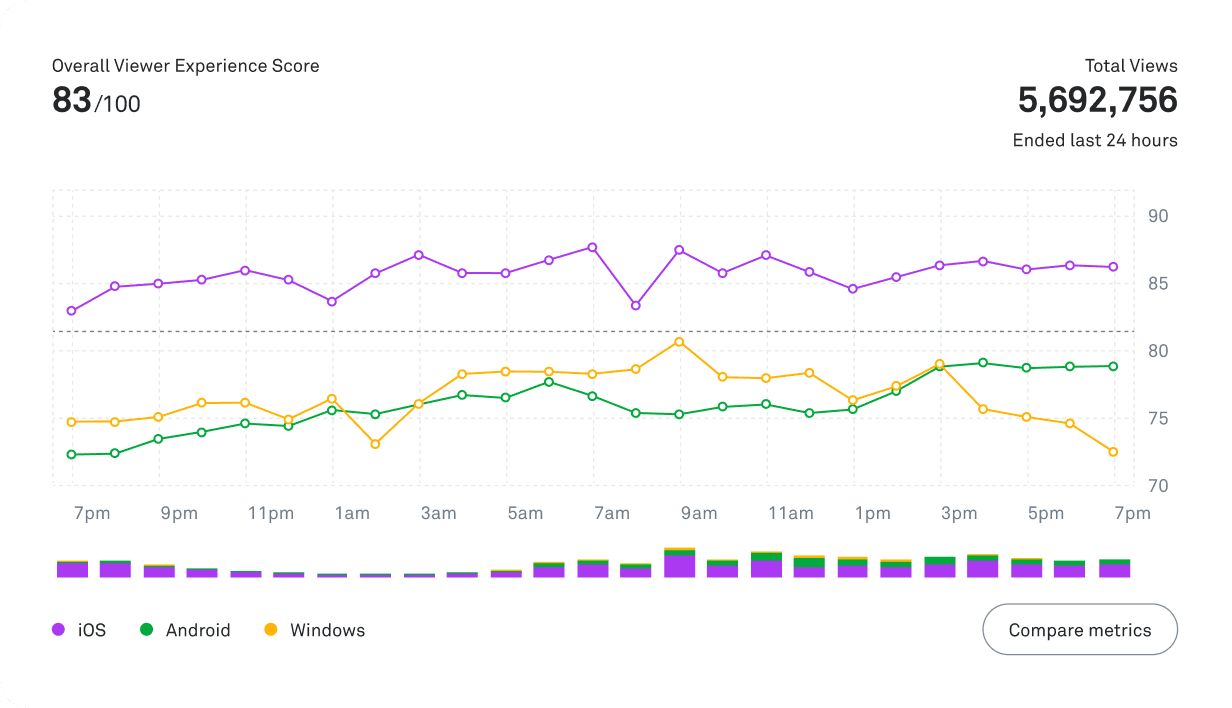
Behind the world’s largest scale
Understand what viewers experience no matter how many people are watching. With Mux Data, you can rely on the infrastructure that supports the world’s largest streaming events, reaching even tens of millions of concurrent viewers.
Your data, fit for your needs
Expertly built. Expertly supported.
Get started for free
Actionable insights. Industry-leading speed.
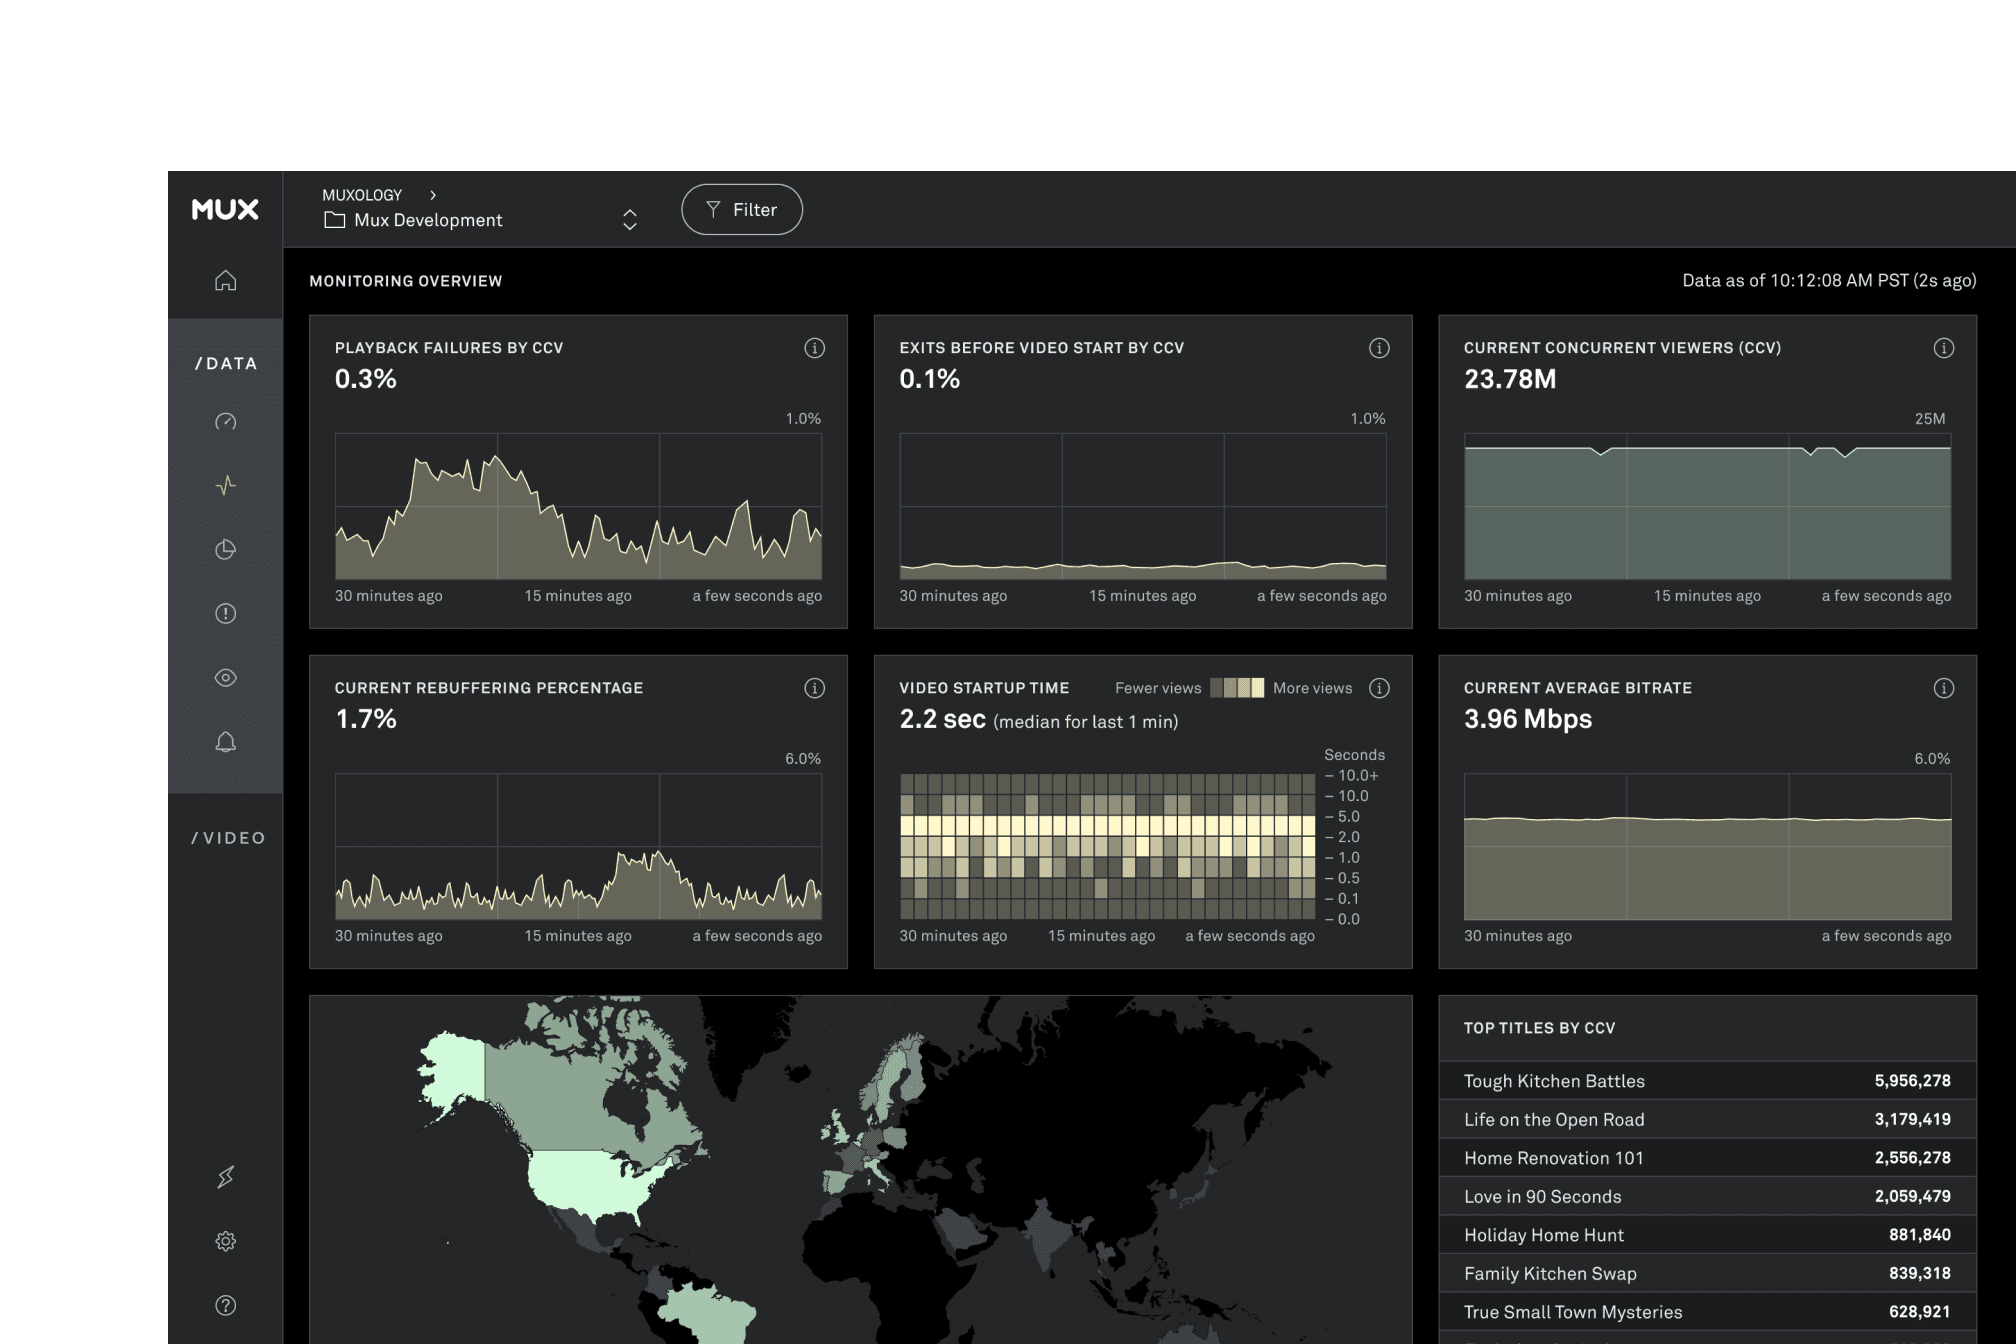
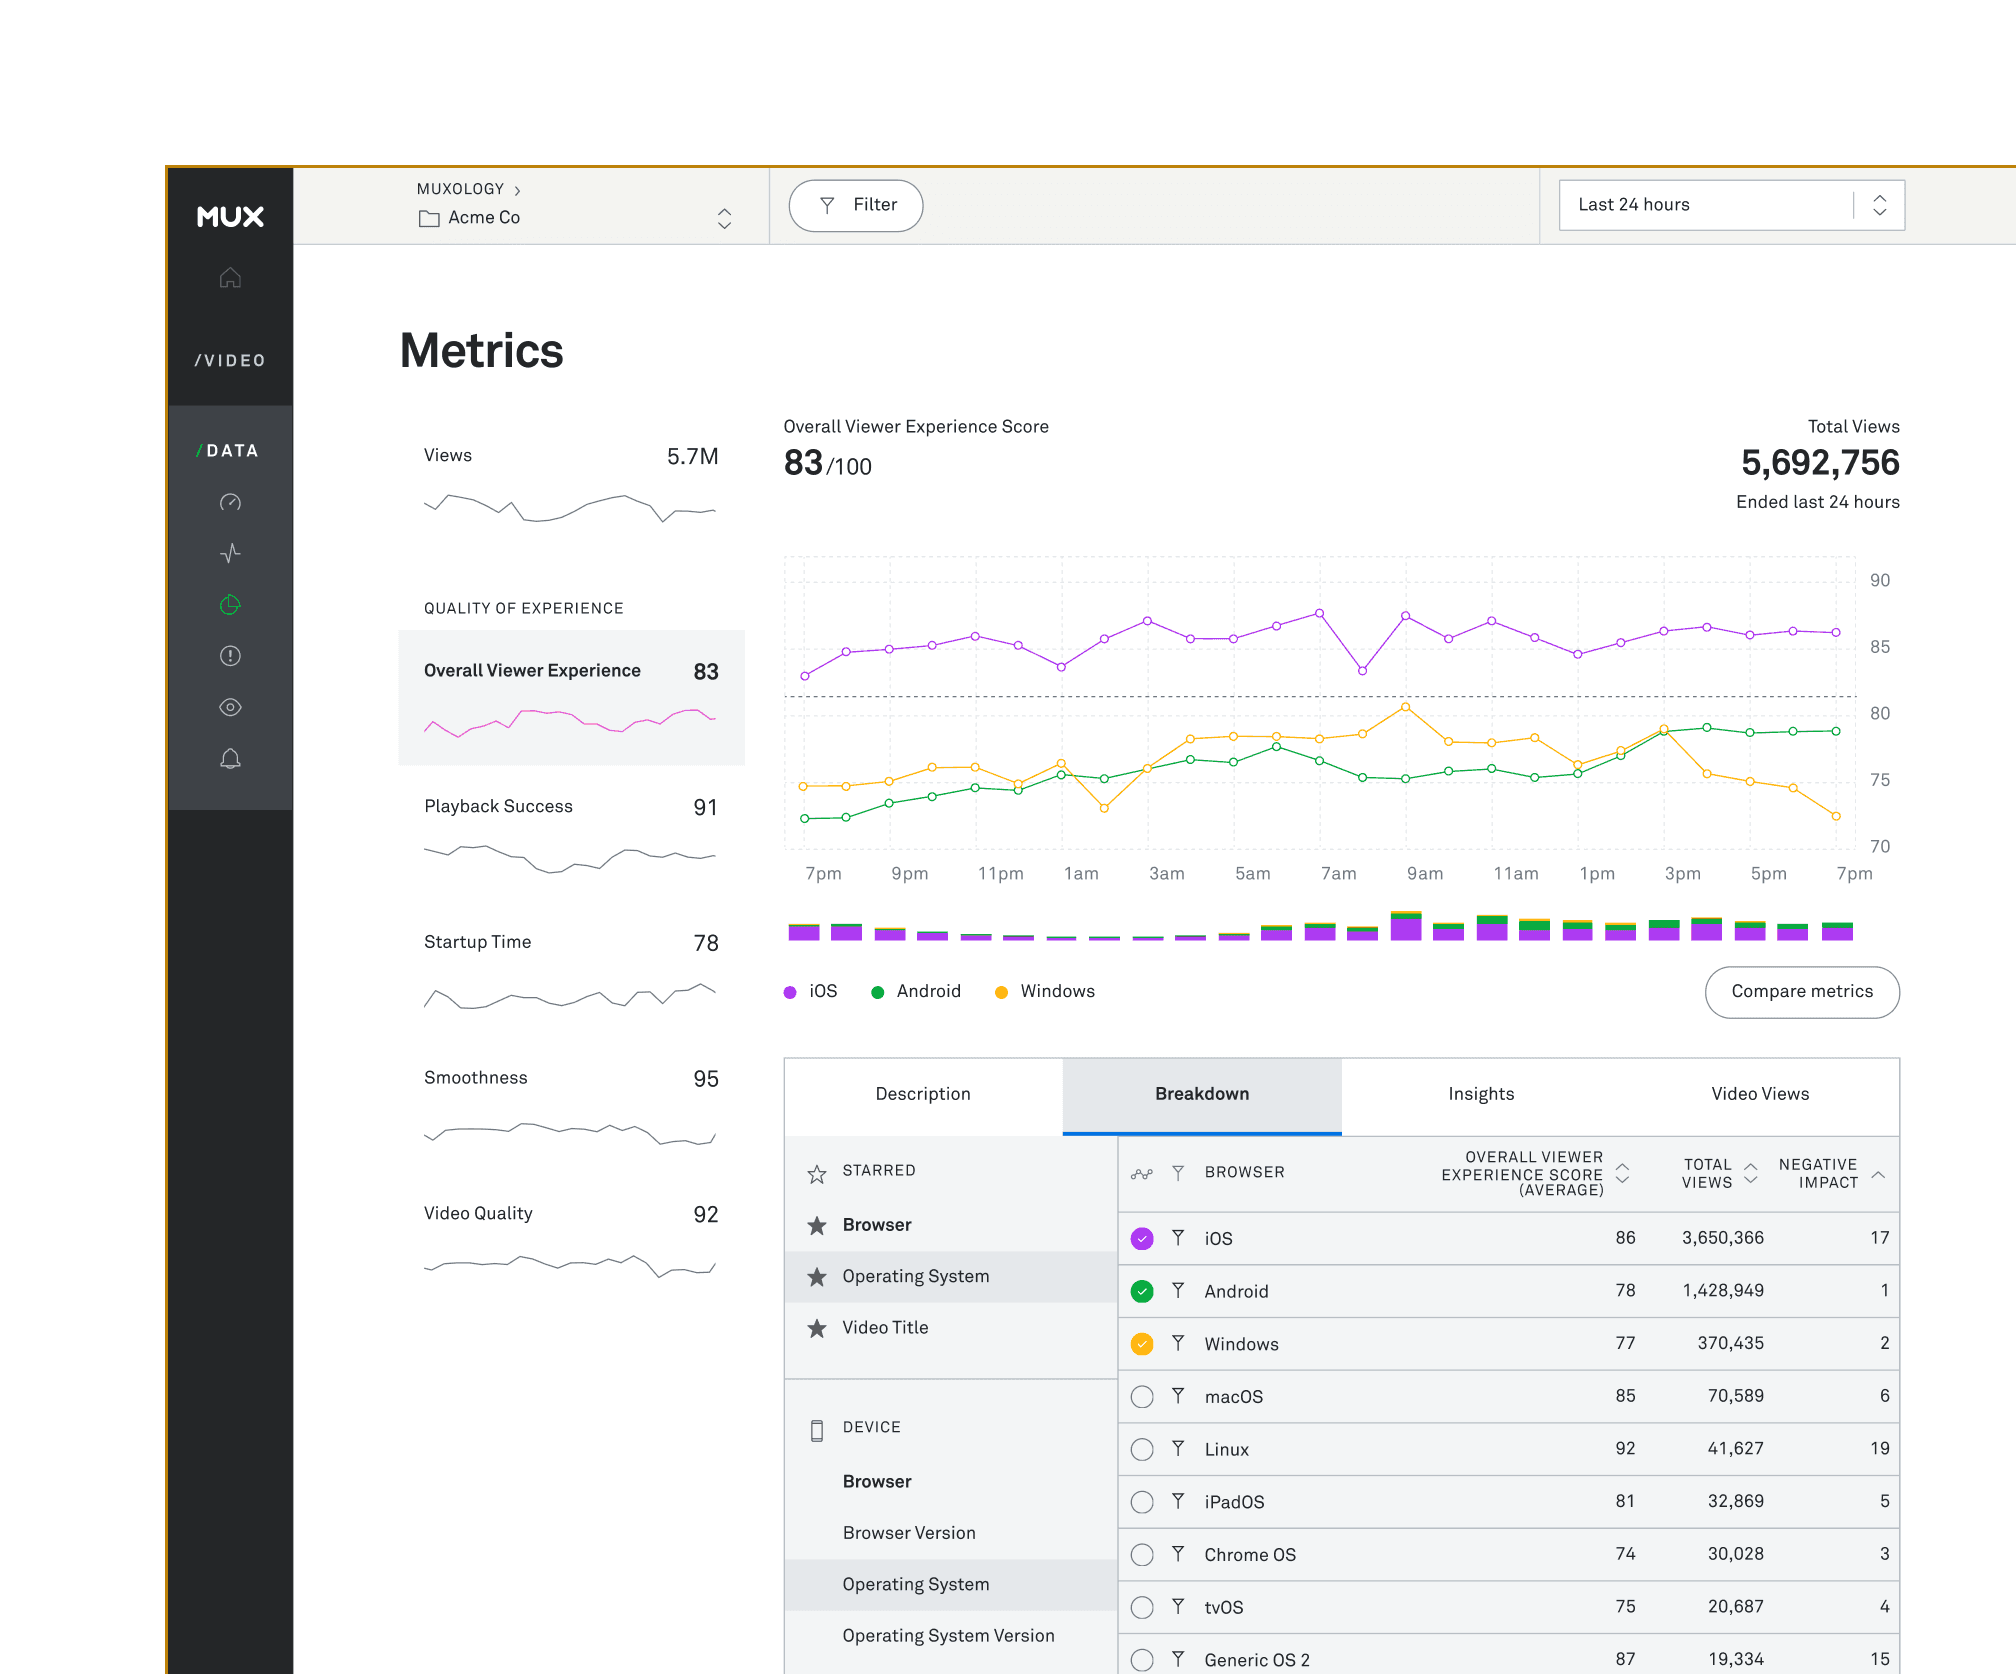
Monitor critical metrics in real time through a single, operational dashboard — so you can handle major streaming issues before your support team is overwhelmed. Plus, you’ll get the insights fast, with a lower latency than any alternative in the industry.
End-to-end visibility. Including CMCD.
Get visibility on everything from the player to ads to CDNs, and evaluate every piece of your video workflow. With easy-to-integrate technology, like CMCD, you can tie your QoE analytics together with your CDN performance logs to pinpoint the causes of viewer issues or see the impact of ads and ad servers on your viewers’ experience. With tons of standard and custom dimensions, you can track the full picture of your video workflow.
See pricing
Data portability. No extra fees.
Combine QoE metrics with data from other analytics and observability platforms that are essential to your business. Export real-time and historical metrics into your dashboards for “single pane of glass” views on your streaming business. Mux doesn’t limit that data or charge extra integration fees.
Learn more
Understand your performance at a glance
Monitor the key dimensions of video quality of service (QoS): playback failures, startup time, rebuffering, and video quality. With Mux’s industry-first viewer experience scores, you can quickly summarize your video platform’s performance on a daily or weekly basis. Benchmark your metrics against other Mux customers to help understand where you have the biggest potential for improvement.

See what’s happening (before users do)
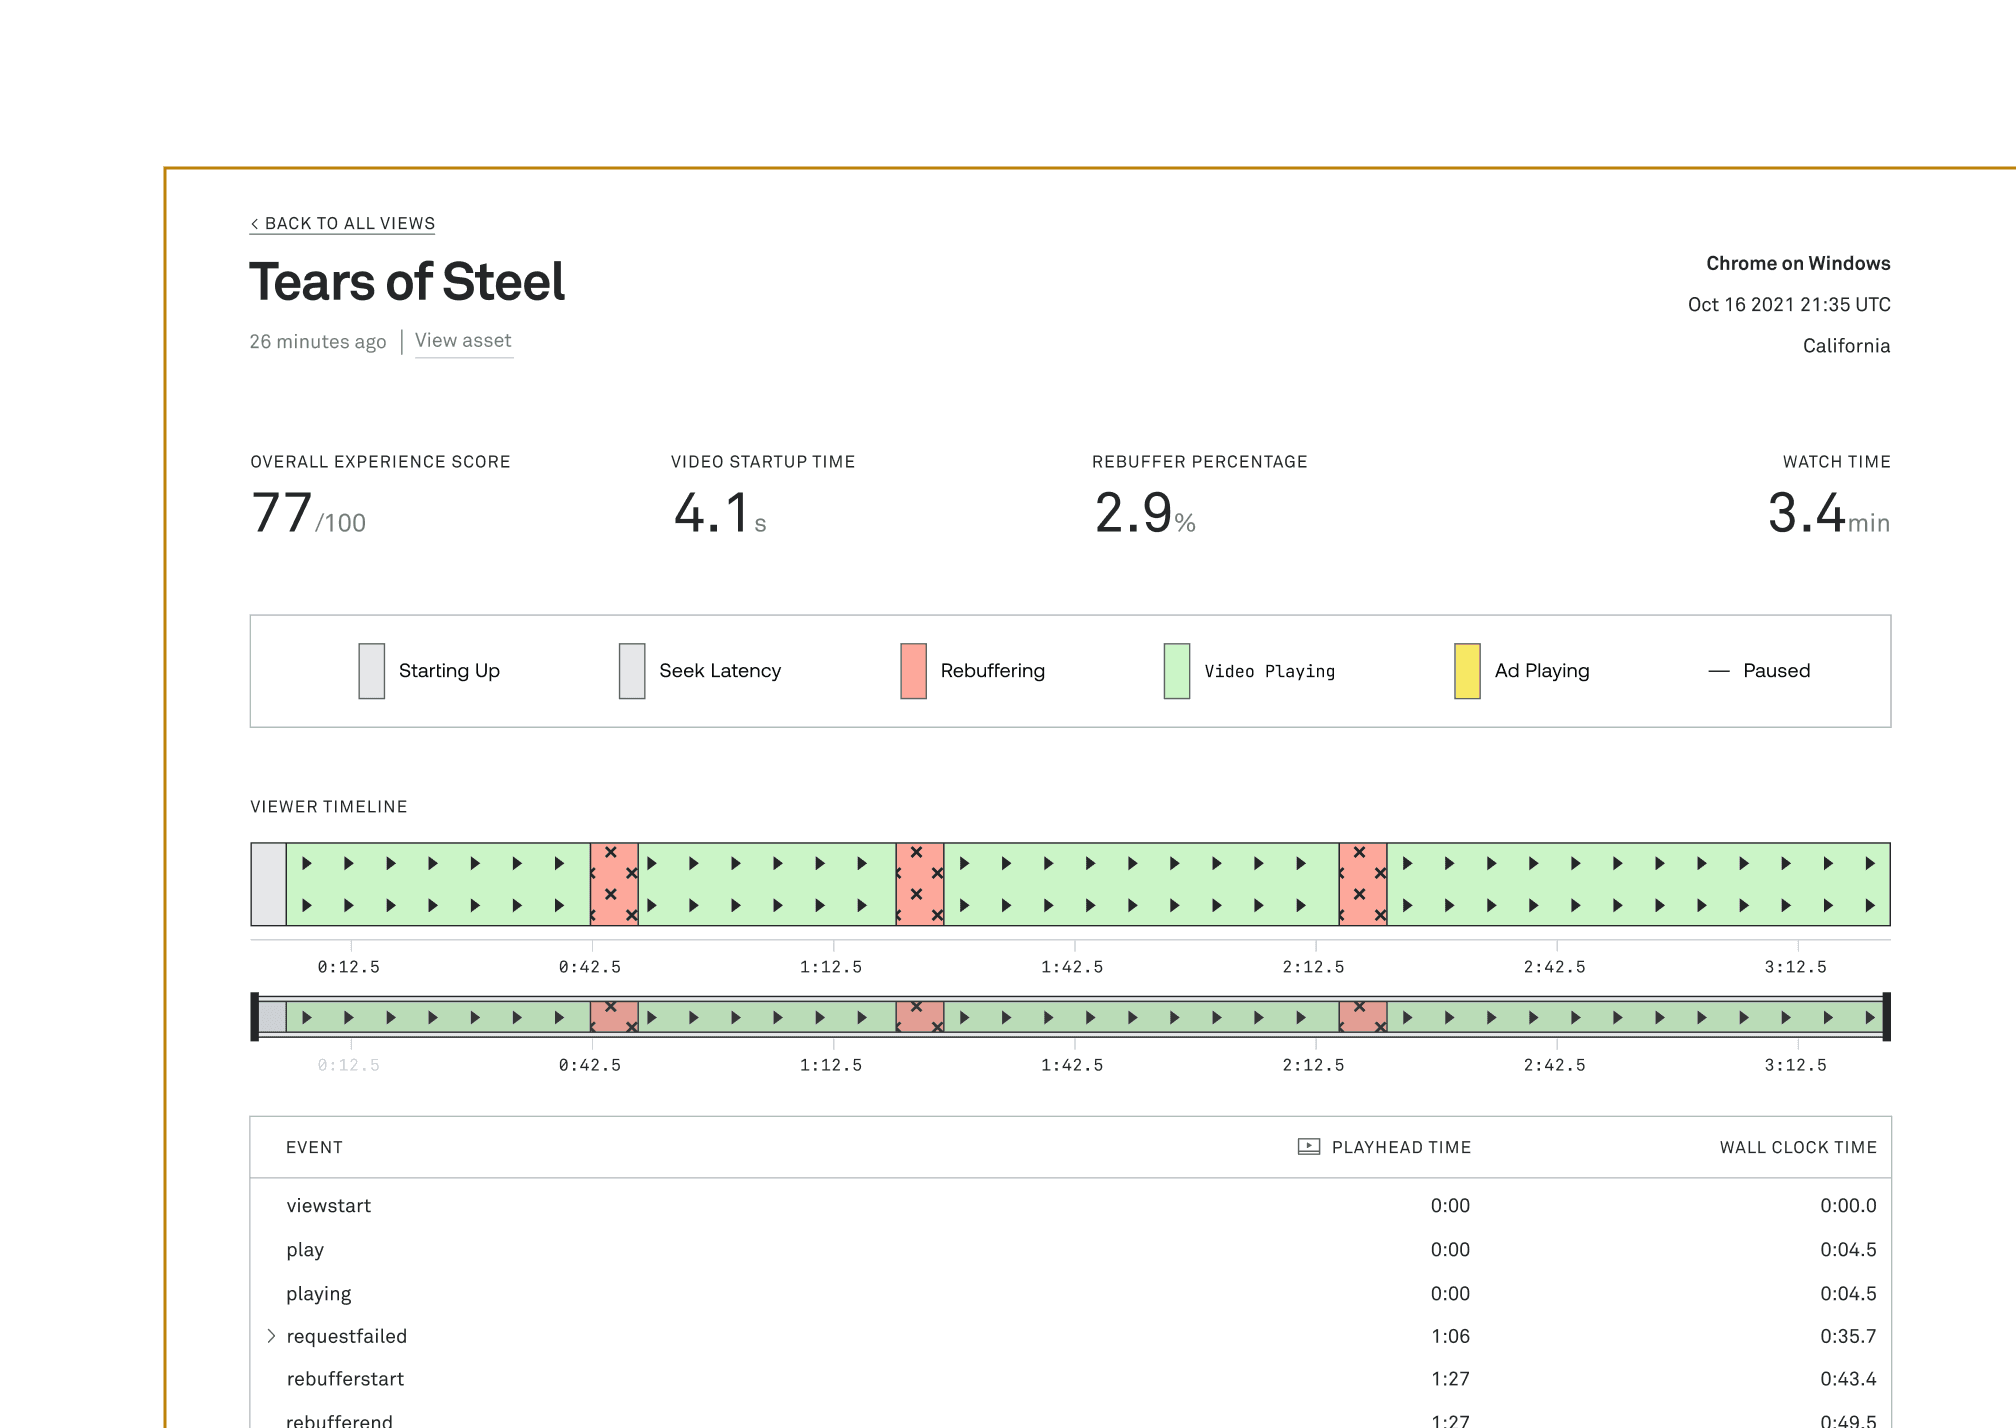
Get alerts when something goes wrong, and use Mux’s powerful dashboard to dig deeper. Track video playback down to the individual view level, so your engineering and support teams can know exactly what’s happening on every user’s device and debug more effectively.
Deeply understand user engagement
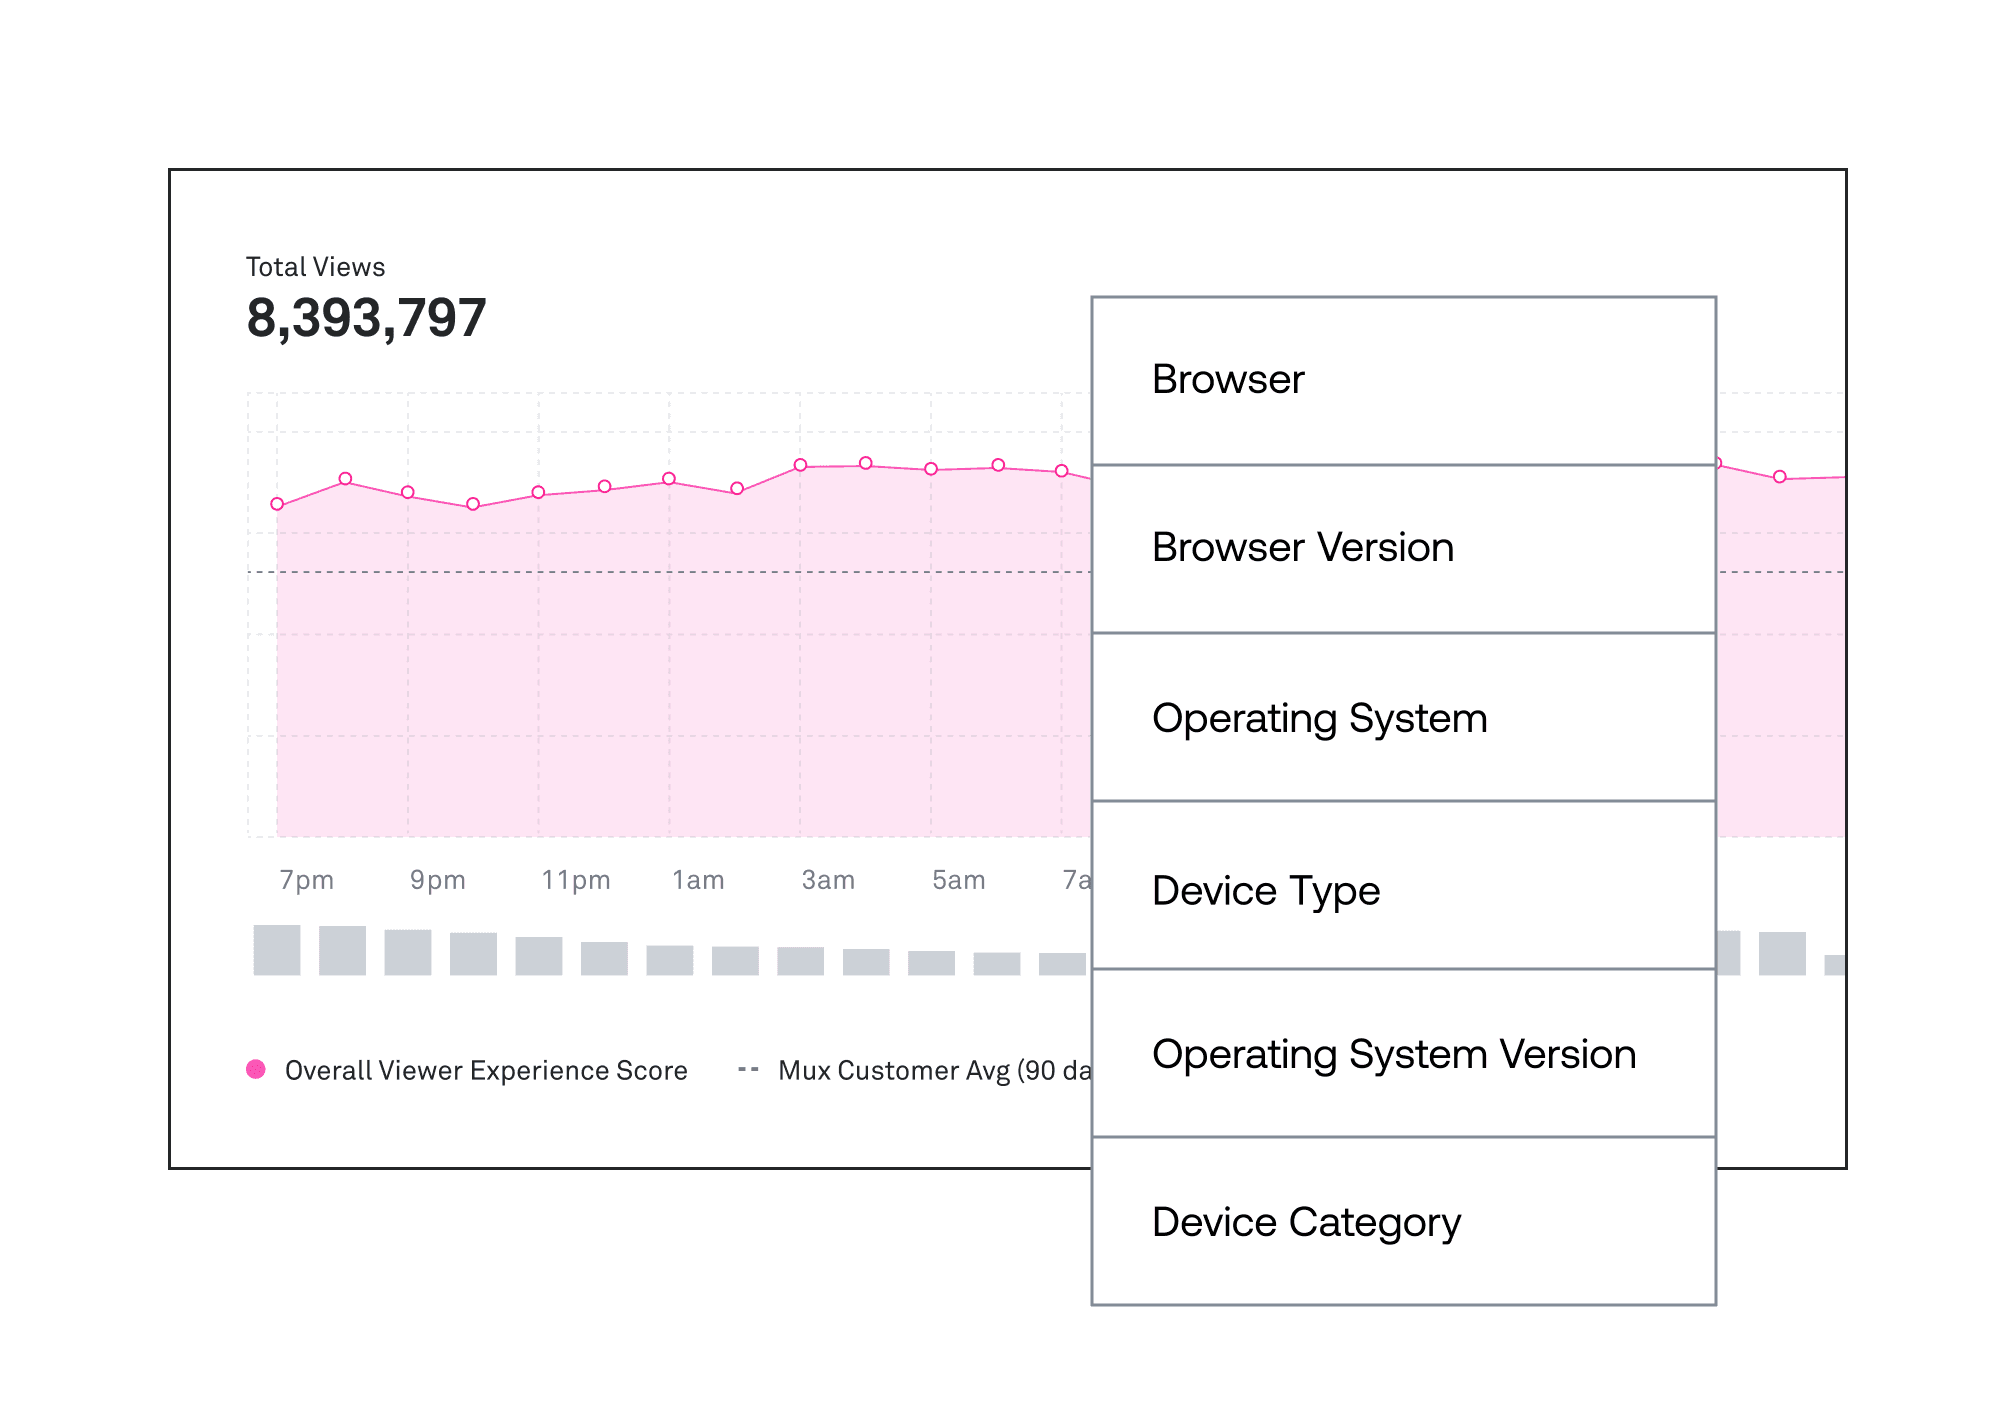
Report on the engagement of live vs. on-demand video, views per device type, distribution of traffic across your different player platforms, and other metadata fields that are mission-critical to your teams.
Evaluate technology using real data
Pick the player, CDN, ad server, and other services that perform best for your specific platform through A/B testing and performance monitoring.
Spend your time and money where it counts
With our Negative Impact Score and Impact Sorting, you can quickly learn which browsers, devices, regions, CDNs, players, ads, and videos are creating the most problems for your viewers, and watch as your efforts make users happier.
Technical specs
Metrics tracked
Requests for First Preroll
Filters available
- Device
- Browser
- Browser Version
- Operating System
- Operating System Version
- Device Name
- Device Model
- Device Category
- Device Brand
- Remote Played?
- View
- Viewer ID
- Error Code
- Exited Before Video Start?
- View Has Ad
- Page Type
- Video Startup Failure
- Ad Startup Failure
- Content Playback Failure
- Playback Business Exception
- Video Startup Business Exception
- Player
- Player Name
- Player Version
- Player Software
- Player Software Version
- Mux Plugin
- Mux Plugin Version
- Autoplay?
- Preload?
- Geography
- Continent
- Country
Region/State
- Video
- Video Title
- Video ID
- Video Series
- Content Type
- Mux Playback ID
- Mux Asset ID
- Mux Live Stream ID
- Stream
- Source Type
- Stream Type
- Sub Property ID
- Encoding Variant
- Experiment Name
- DRM Type
- Network
- ASN
- CDN
- Source Hostname
- Connection Type
- View Session ID
- Advertising
- Preroll Ad Asset
- Hostname
- Preroll Ad Tag
- Hostname
- Preroll Requested?
- Preroll played?
- Up to 10 custom filters
Video players supported
- Generic HTML5
- Video.js
- HLS.js
- Dash.js
- Shaka Player
- Brightcove
- Azure Media Player
- JW Player
- Bitmovin Player
- Kaltura
- Ooyala Player
- THEOplayer
- Flowplayer
- Comcast Technology
- Solutions/
thePlatform PDK - Akamai Media Player
- Web
- AgnoPlay
- Apple iOS (v9+)
- Android ExoPlayer (v2.9+)
- Android MediaPlayer
- Brightcove Player for iOS and Android
- JW Player for iOS and Android
- THEOplayer for iOS and Android
- Kaltura for iOS and Android
- React Native Video
- Roku
- Chromecast
- Apple TV tvOS(v9+)
- Fire TV
- Samsung Tizen
- LG WebOS
- Mobile
- OTT
Mux Data is included with every Mux Video stream.
Need to use your
current video solution?
Get 100K monthly views for free.
Additional views at $0.60/1000.
Need help?
Our engineers provide hands-on support via mux.com/support.
Integration is easy. Just sign up and follow the instructions in our docs or watch the video.
No credit card required to start using Mux.