Rebuffering is the most noticeable and most annoying fault for a viewer to experience. That little rolling wheel is the symbol for a bad viewer experience.
In the days of Progressive Video, rebuffering was caused by there not being enough bandwidth for the video to be loaded. Simple enough. But, now that Adaptive Streaming has come to dominate online video, it’s become a little more complicated. In either case, the blame can sway between the Internet Service Provider, the Content Delivery Network, or the original Publisher.
Before we dive further into this subject, let’s review some terminology regarding Buffering.
In this article we will be focusing on the issue where: a viewer has been receiving video playback, but it then stops, and the video has to “catch up”. We call this “Rebuffering” to distinguish it from “Buffering” which can include other things. Other people may also call this Video “Stall” or “Stalling”. When a consensus on terms is finally reached, we will let you know, bur for now we are sticking to Rebuferring.
Mux’s Rebuffering Metrics
At Mux we have four different rebuffering metrics along with our overall rebuffering score. While the Rebuffer Score can give you a brief overview of whether buffering is currently a problem or not, the individual metrics we’re going to go over in this post can reveal more precise details.
Rebuffering percentage
The Rebuffering Percentage reflects the amount of time video spent rebuffering, as a percentage of the total time video was requested. To put that another way, it’s the percentage of the video a viewer tried to watch video, but was unable to.
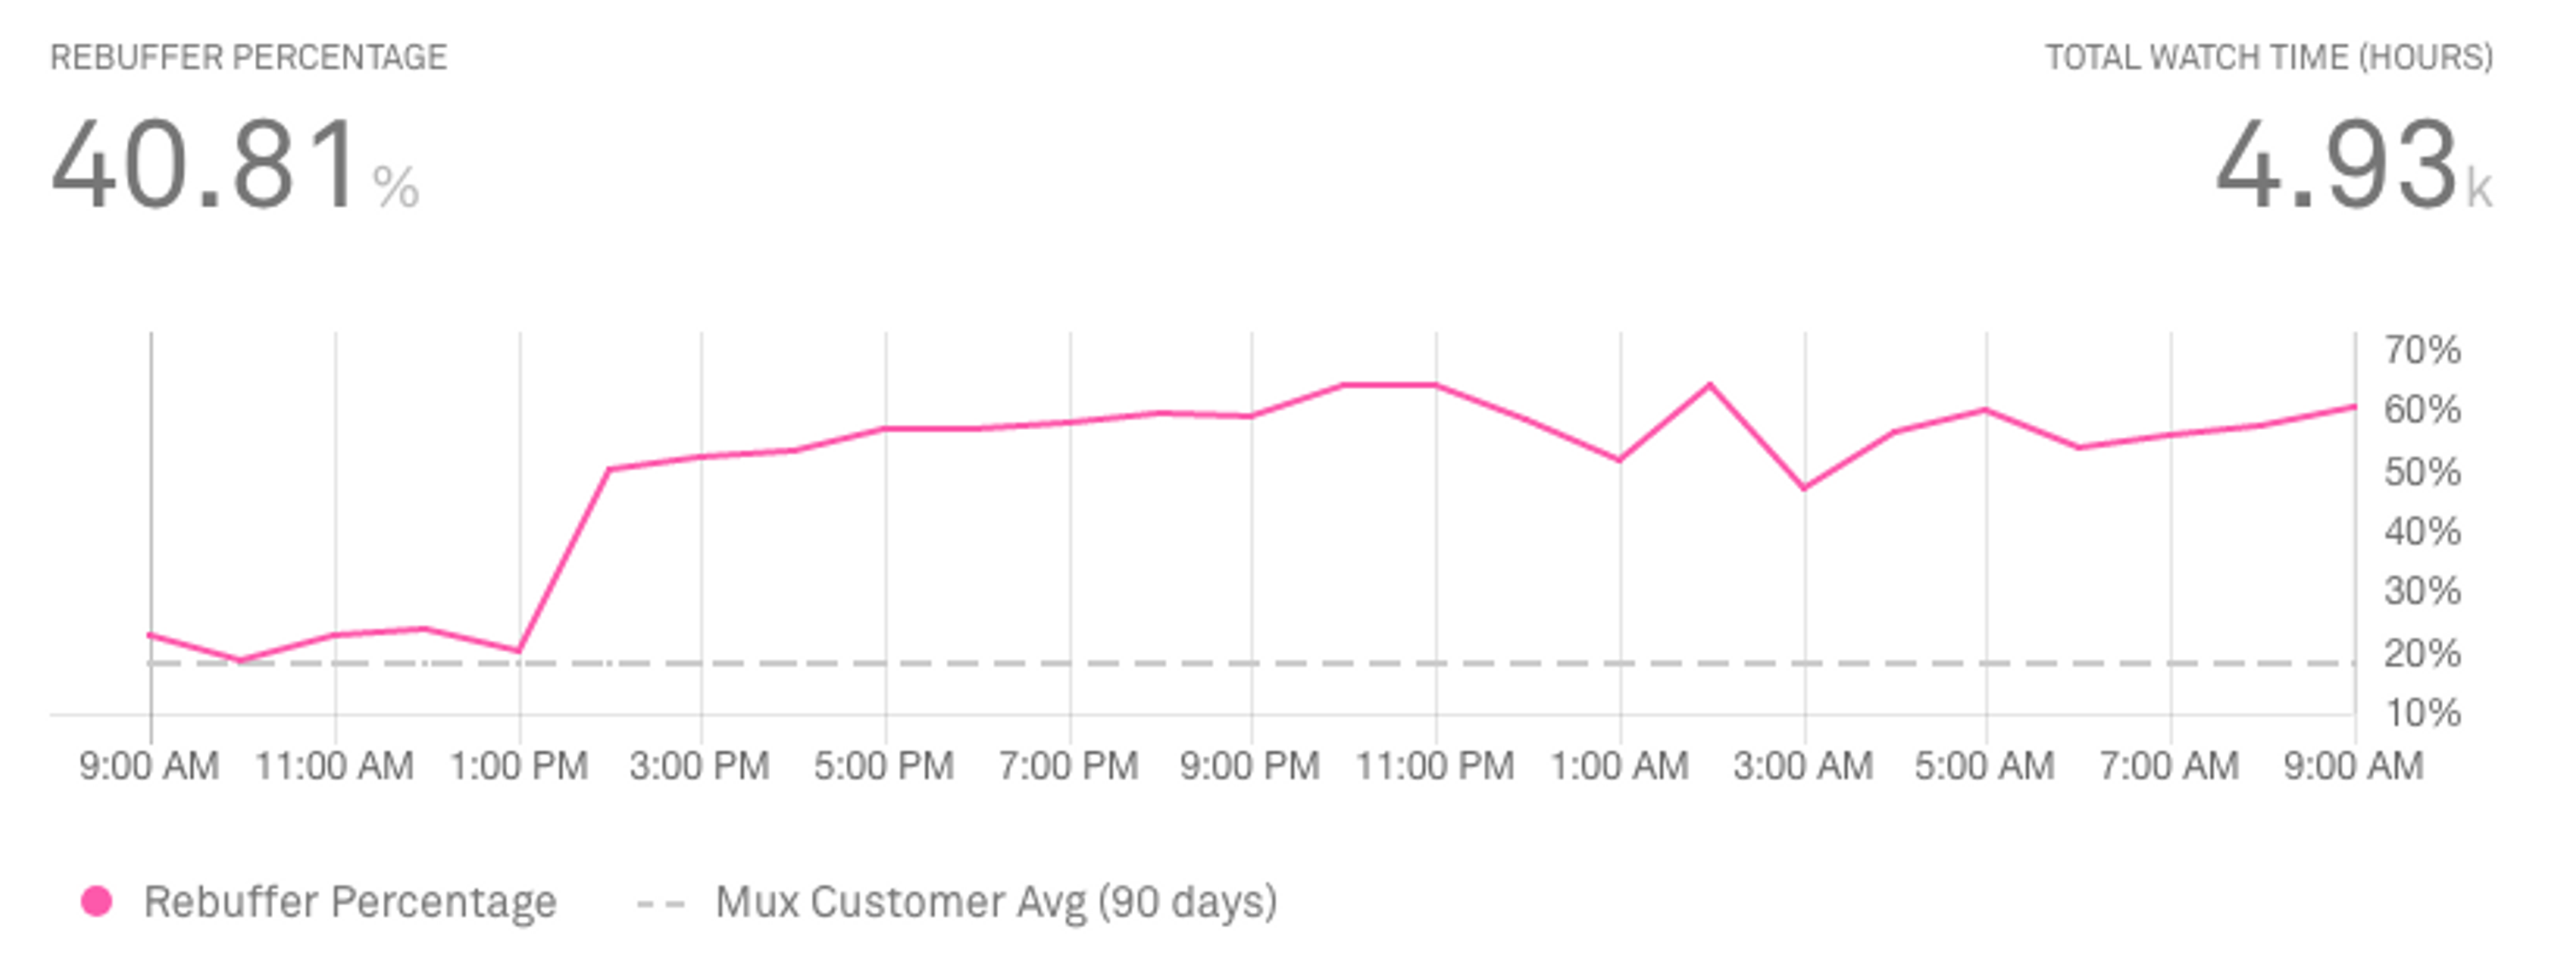
This is a great time to use Mux’s ability to select different ranges. Something like 40% Rebuffering sounds terrible, but when compared with the last 30 days we can more accurately see what is a trend in video delivery problems, compared to a simple spike in latency issues.
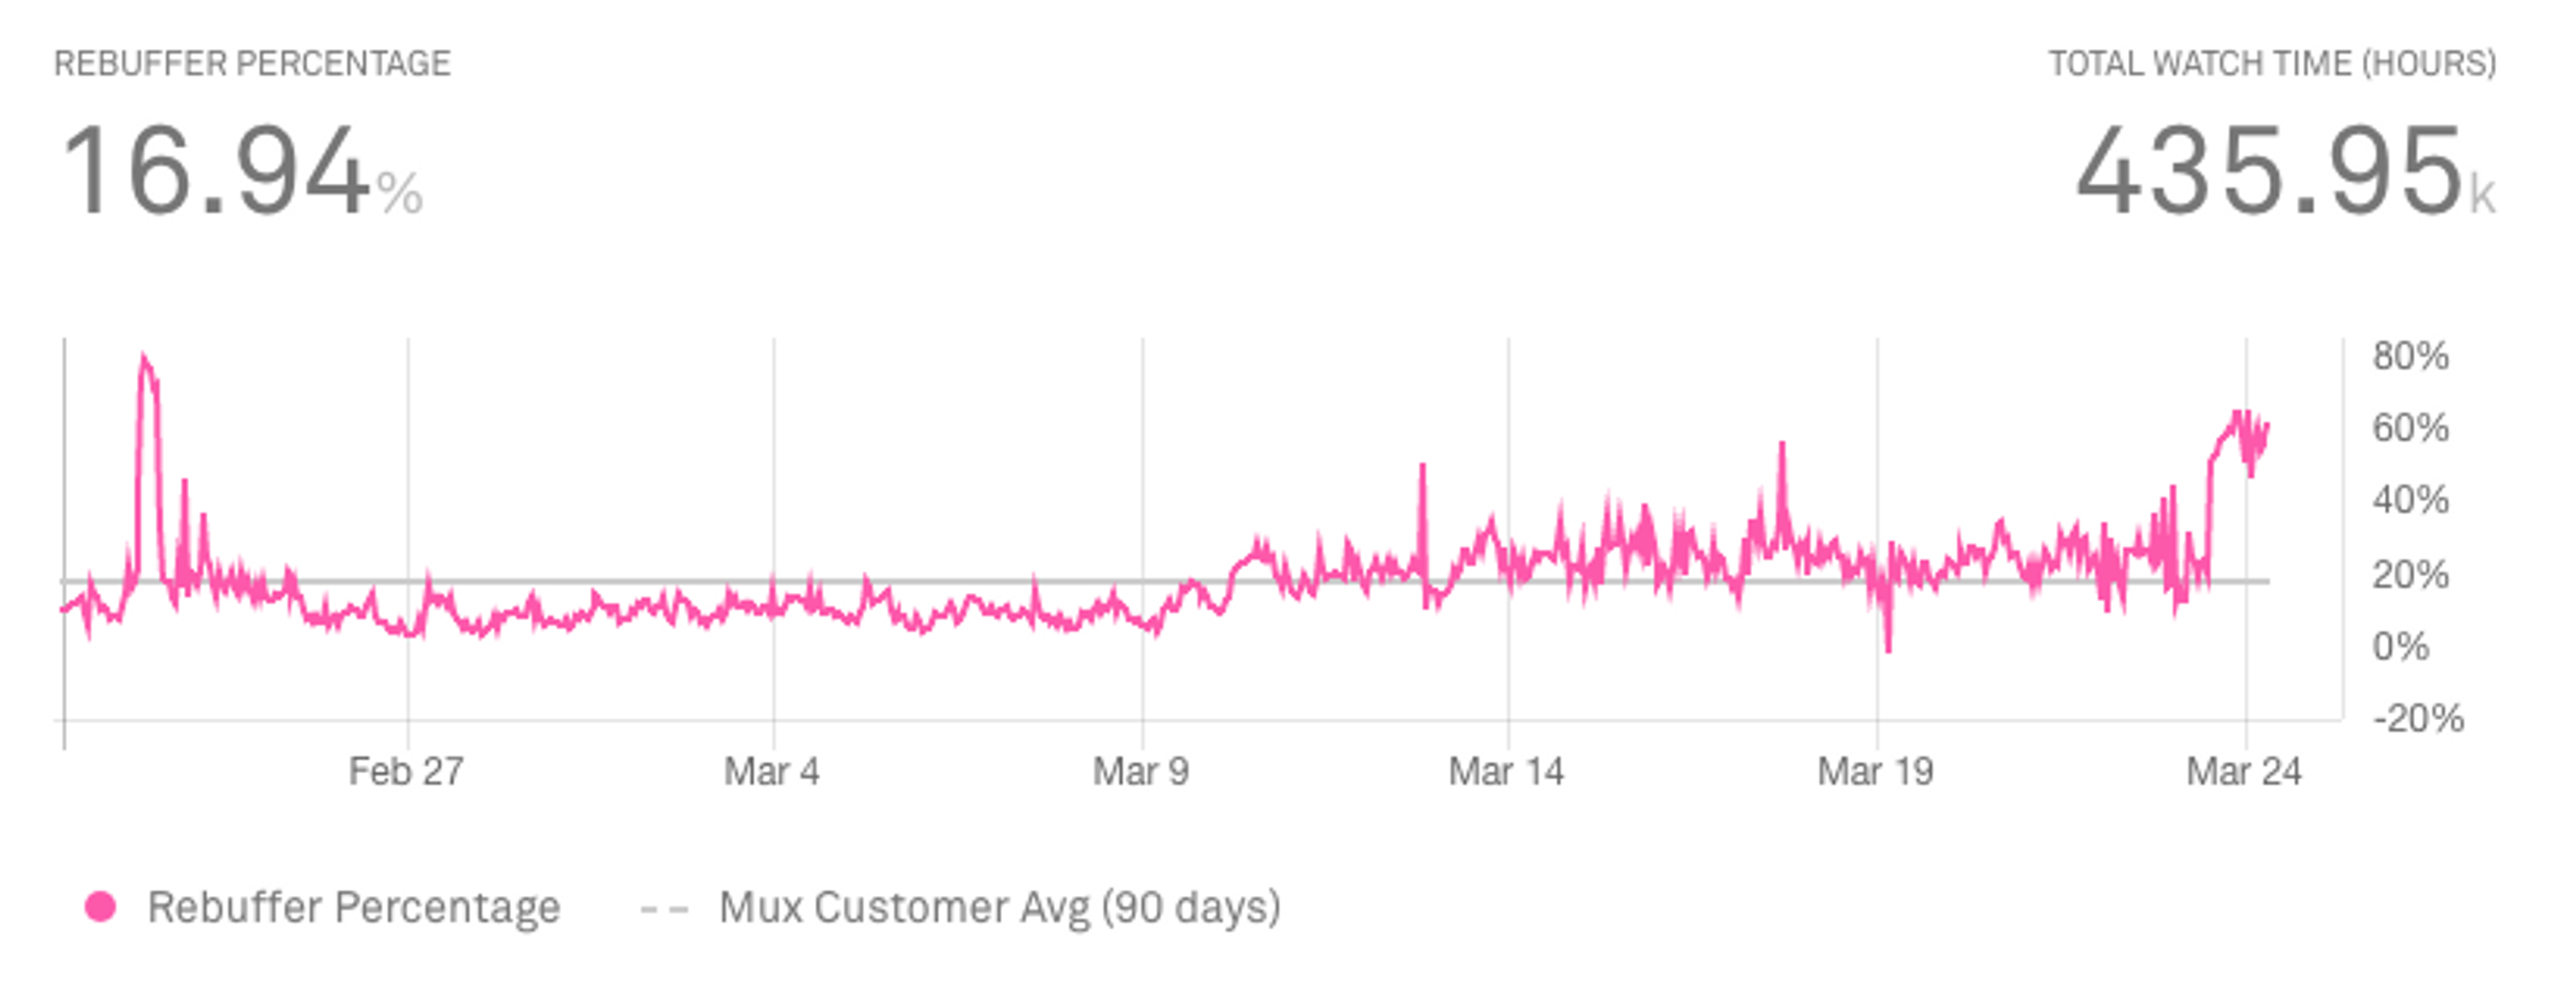
You can also select an array of filters to further scrutinise these metrics, such as Browser, Source Type or specific Video Title.
Rebuffer Frequency
Our Rebuffering Frequency metric looks at how often the video rebuffered per minute of video that the viewer attempted to watch. So a value of 0.50/min means that for every 2 minutes of video, there was one rebuffering instance.
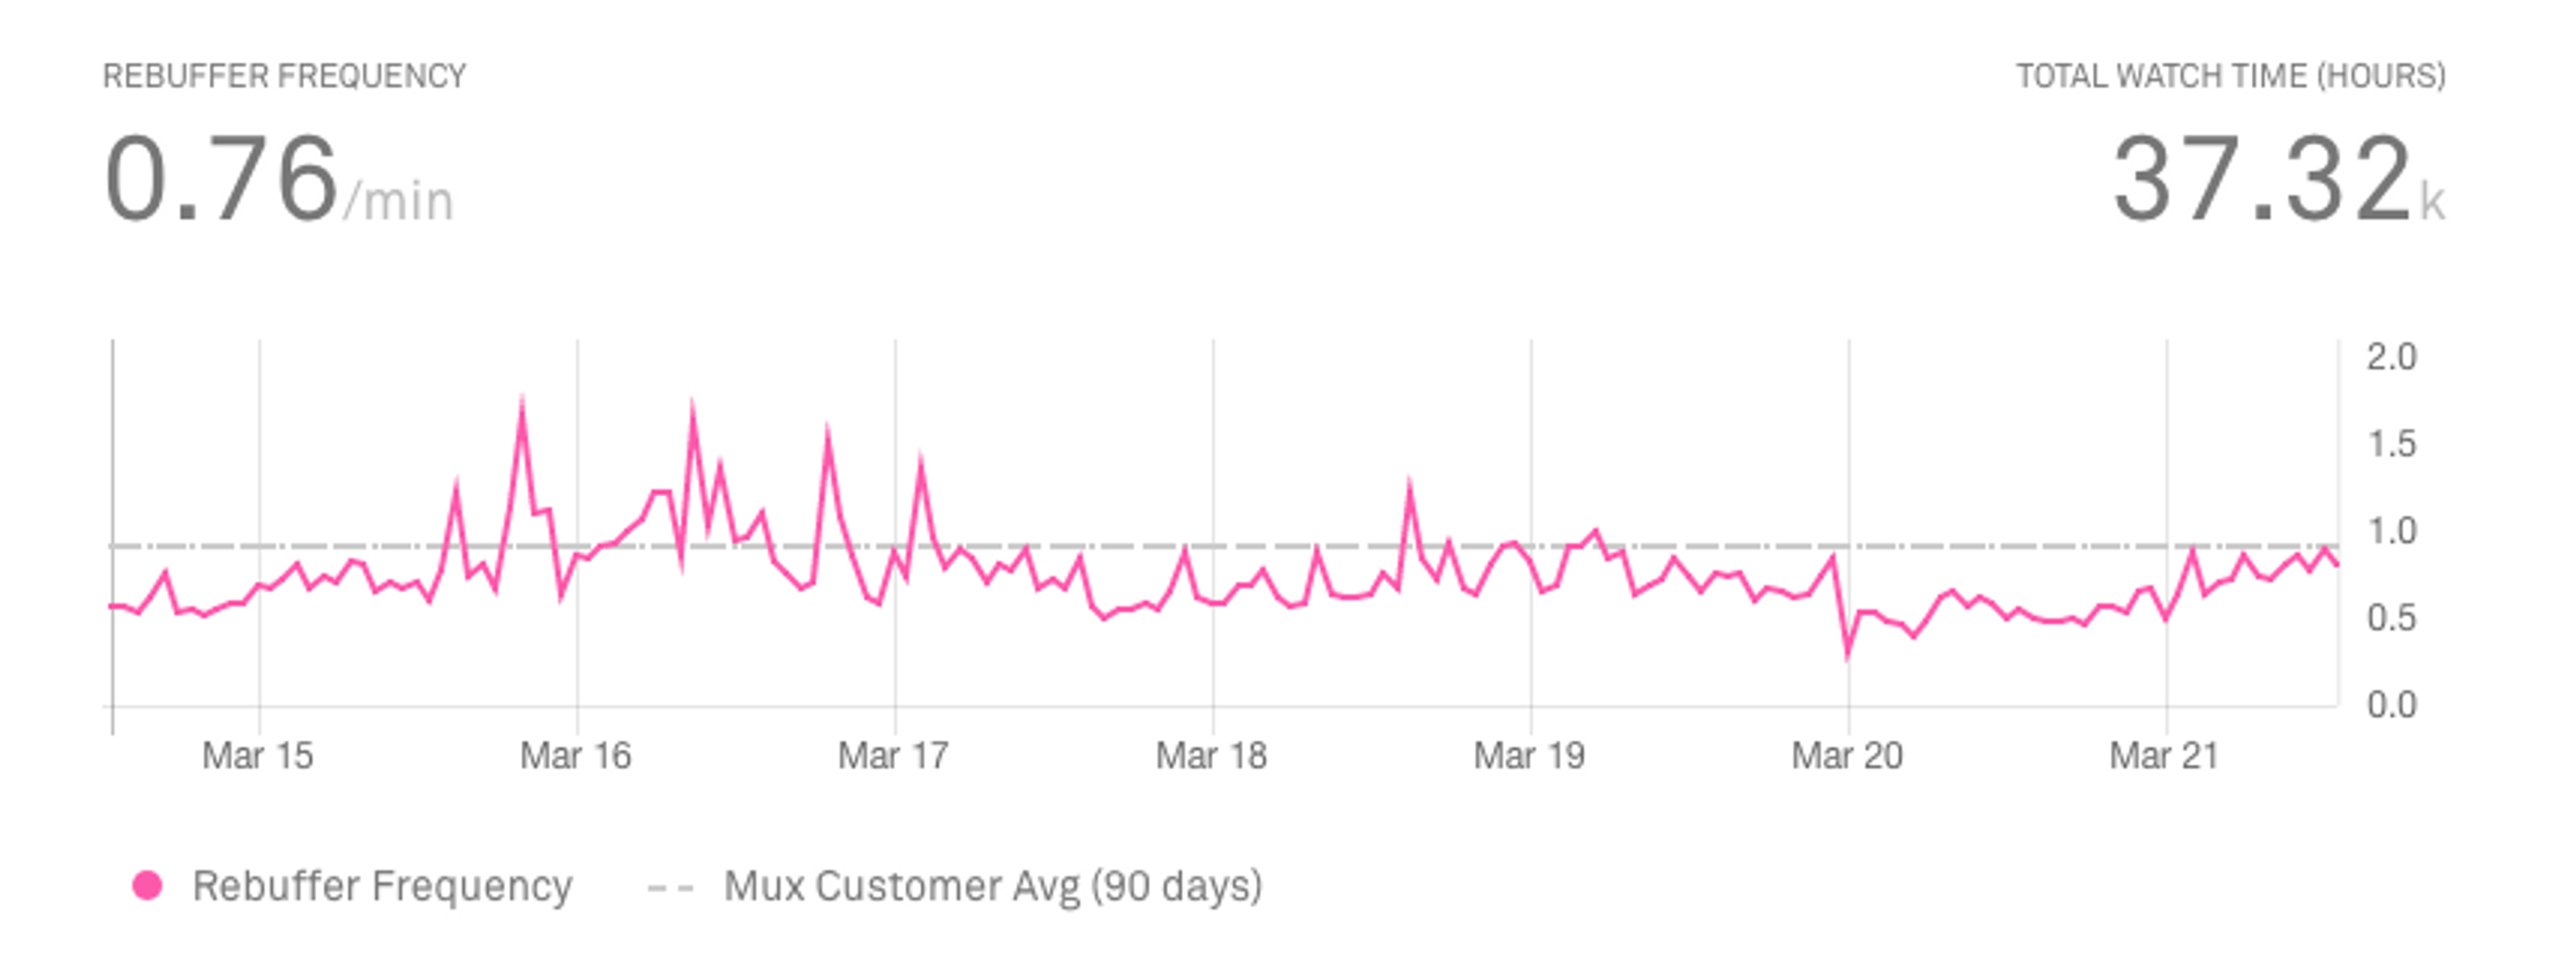
This can tell you how regularly viewers are having their video interrupted by buffering issues, across your video environment. Again, by comparing across different ranges it’s possible to gain a greater sense of what might be a connection issue, or an endemic problem in the video pipeline.
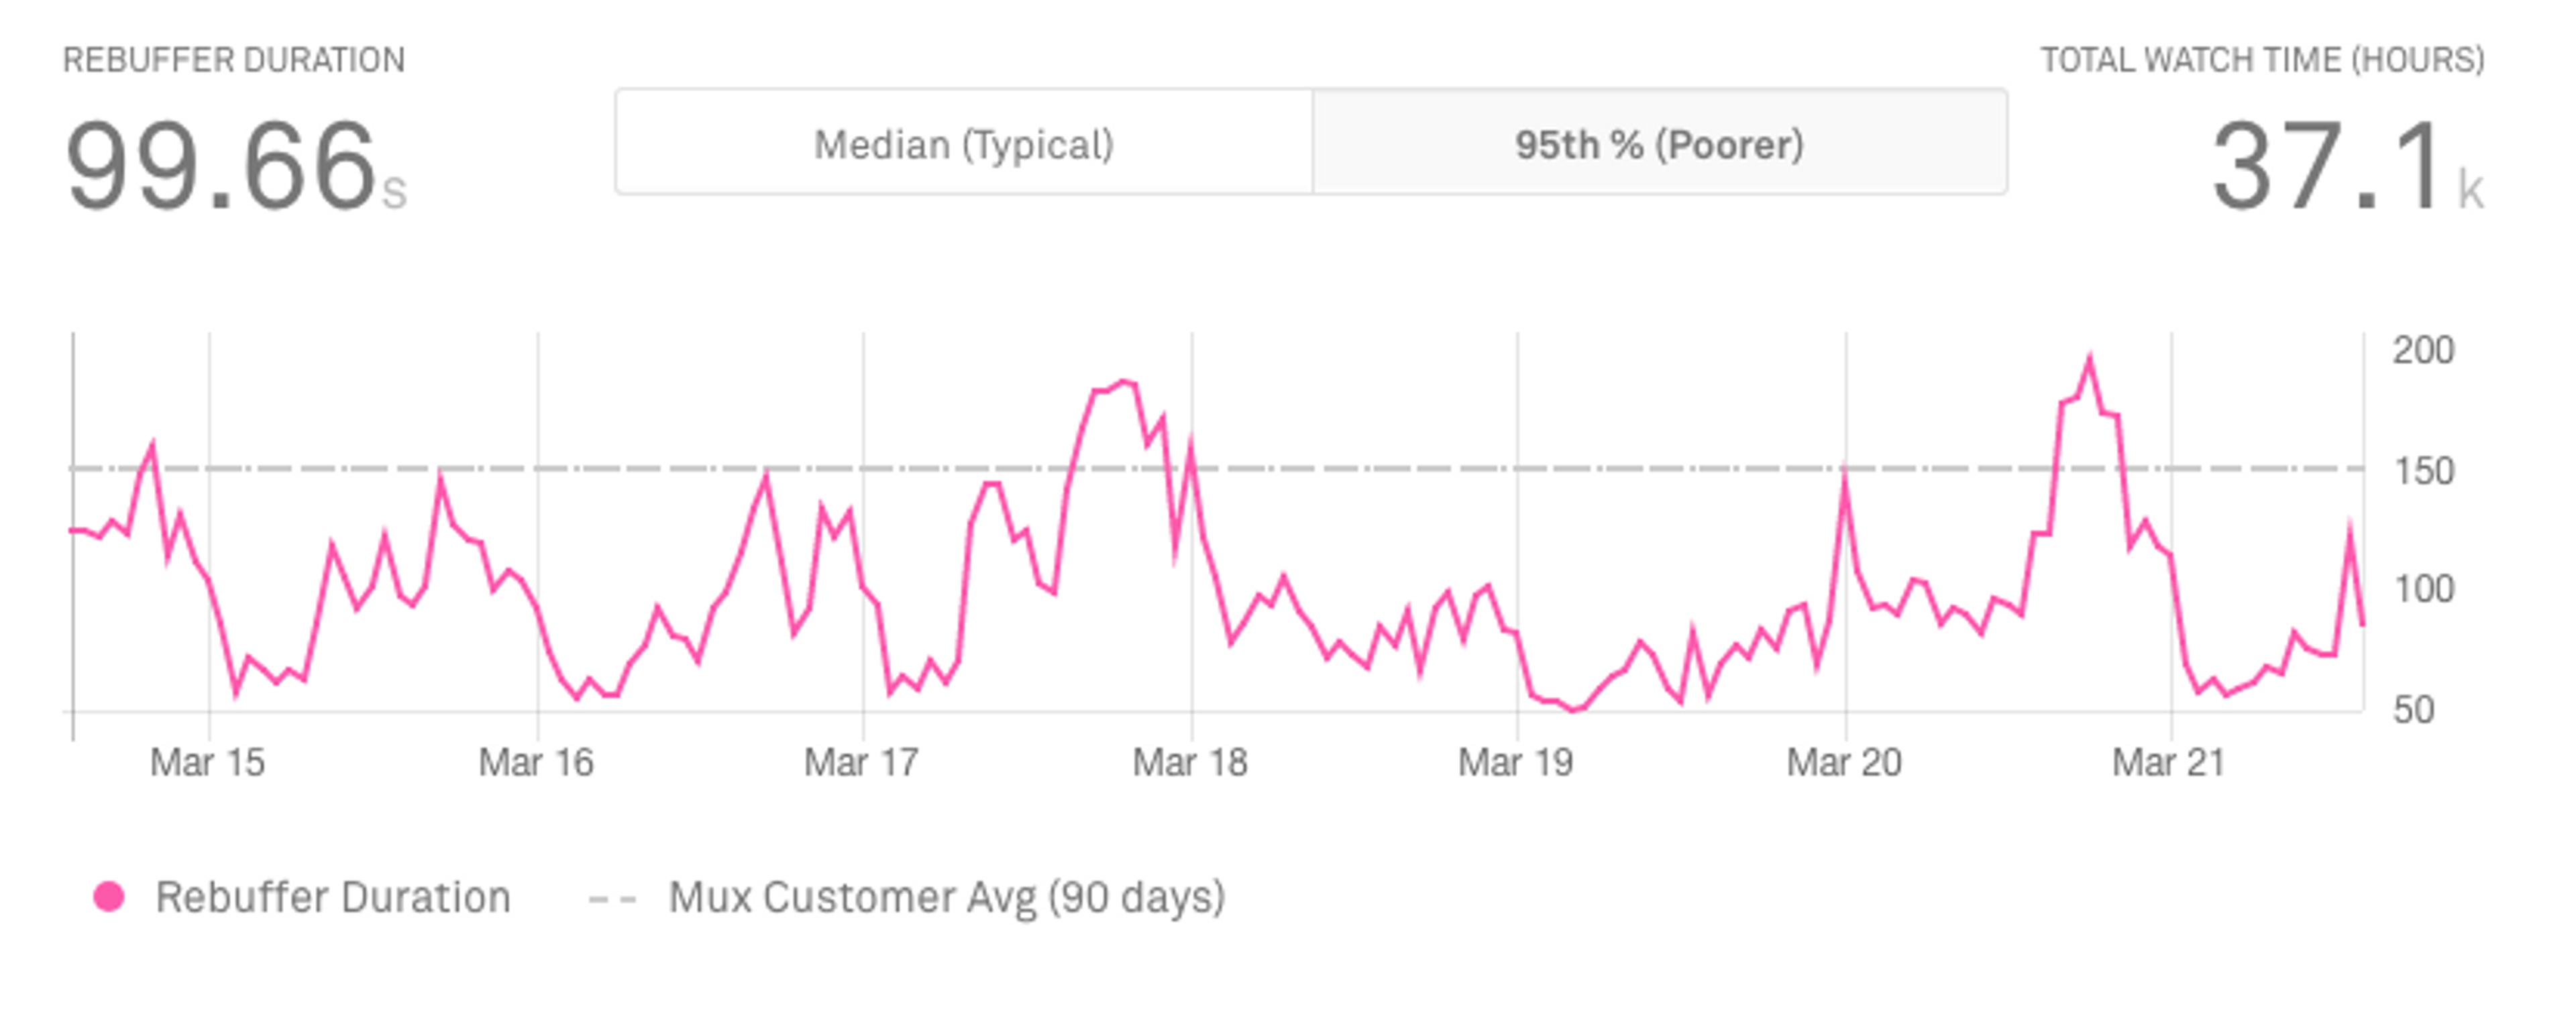
Rebuffer Duration
The Rebuffering Duration metric is getting into depths of buffering issues by detailing how long in seconds the viewer had to wait for their video to reload.
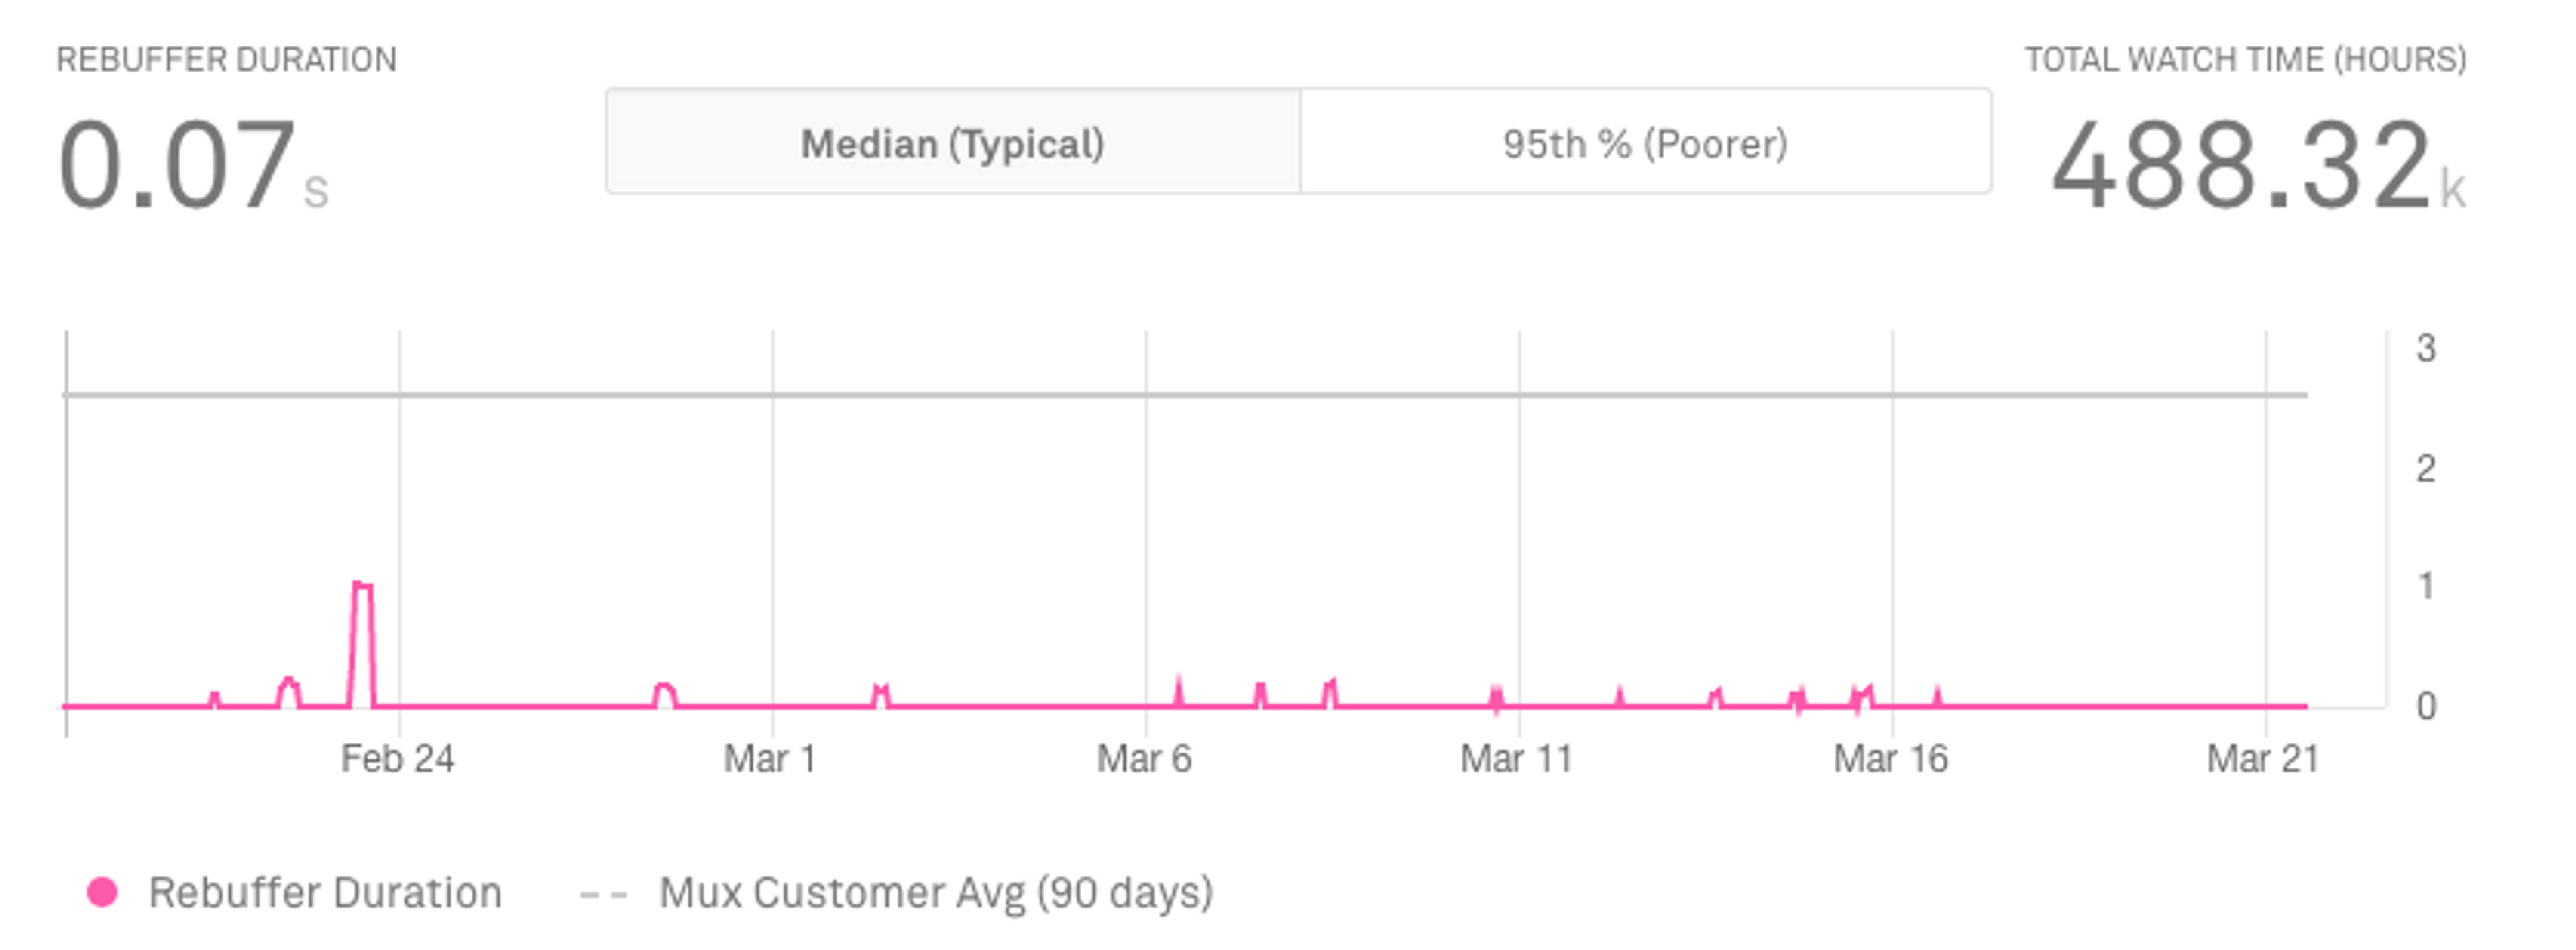
Unlike Rebuffering Percentage, which looks at the overall percentage of video watch time lost to buffering, this metric looks at the actual length of each of those buffering instances and then calculates the Median or 95th Percentile.
Rebuffer Count
Rebuffering Count is the number of rebuffering instances during videos views. Unlike Frequency which looks at the number of rebuffering instances per minute, Rebuffer Count is the total number of times a video rebuffered at all. We represent this data with a Median, or 95th Percentile count.
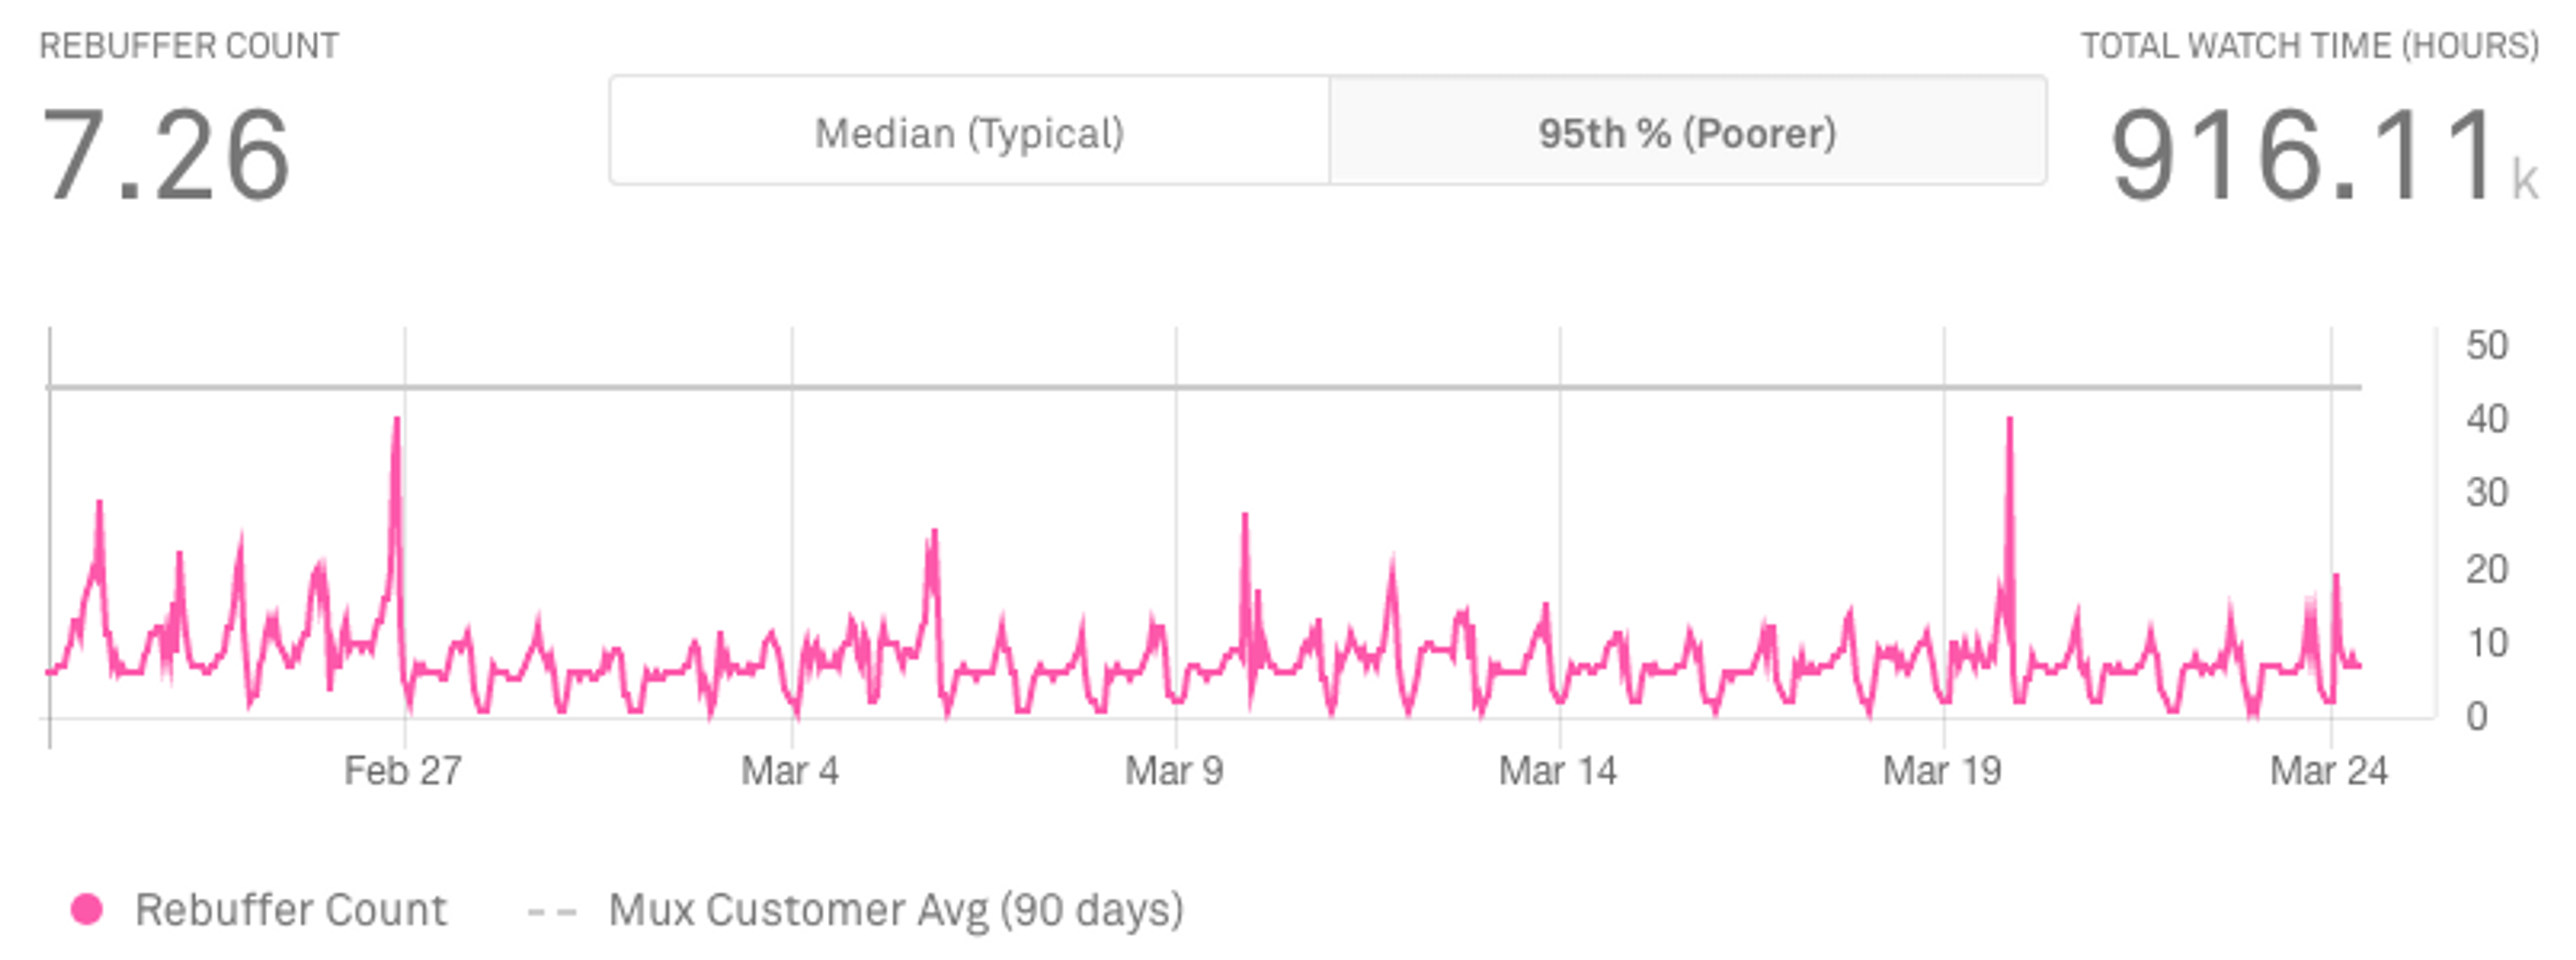
This metric can look pretty binary at first glance. As Internet Service Providers have improved, the video actually stopping to rebuffer once it’s loaded has become a less frequent occurrence.
However, this is a great metric to look at the 95th Percentile. This allows us to look at that bottom 5% of viewers who are not having a great experience.
This is also a great metric to scrutinise by Country, Browser, and Device. We can really delve deep into just how bad the experience is for our worst-hit viewers. Then like all buffering metrics, we can try to investigate what is a trend and what is an anomaly.
Troubleshooting Possible Causes of Rebuffering
The most common culprits of Rebuffering issues are usually: the Internet Service Provider, the Content Delivery Network, Encoding Processes and the Player itself, in that order.
Assuming you have done everything correctly and it's clear sailing on a perfect day, then yes, it probably was the ISP’s fault there was buffering. However if you leave the matter there, you would never improve your video pipeline.
If we think it was the ISPs fault, we can use Mux’s ASN filters to look into which ISPs are causing the biggest problems for our video. This can let us know if it's a specific service provider, or a certain region that is experiencing rebuffering issues.
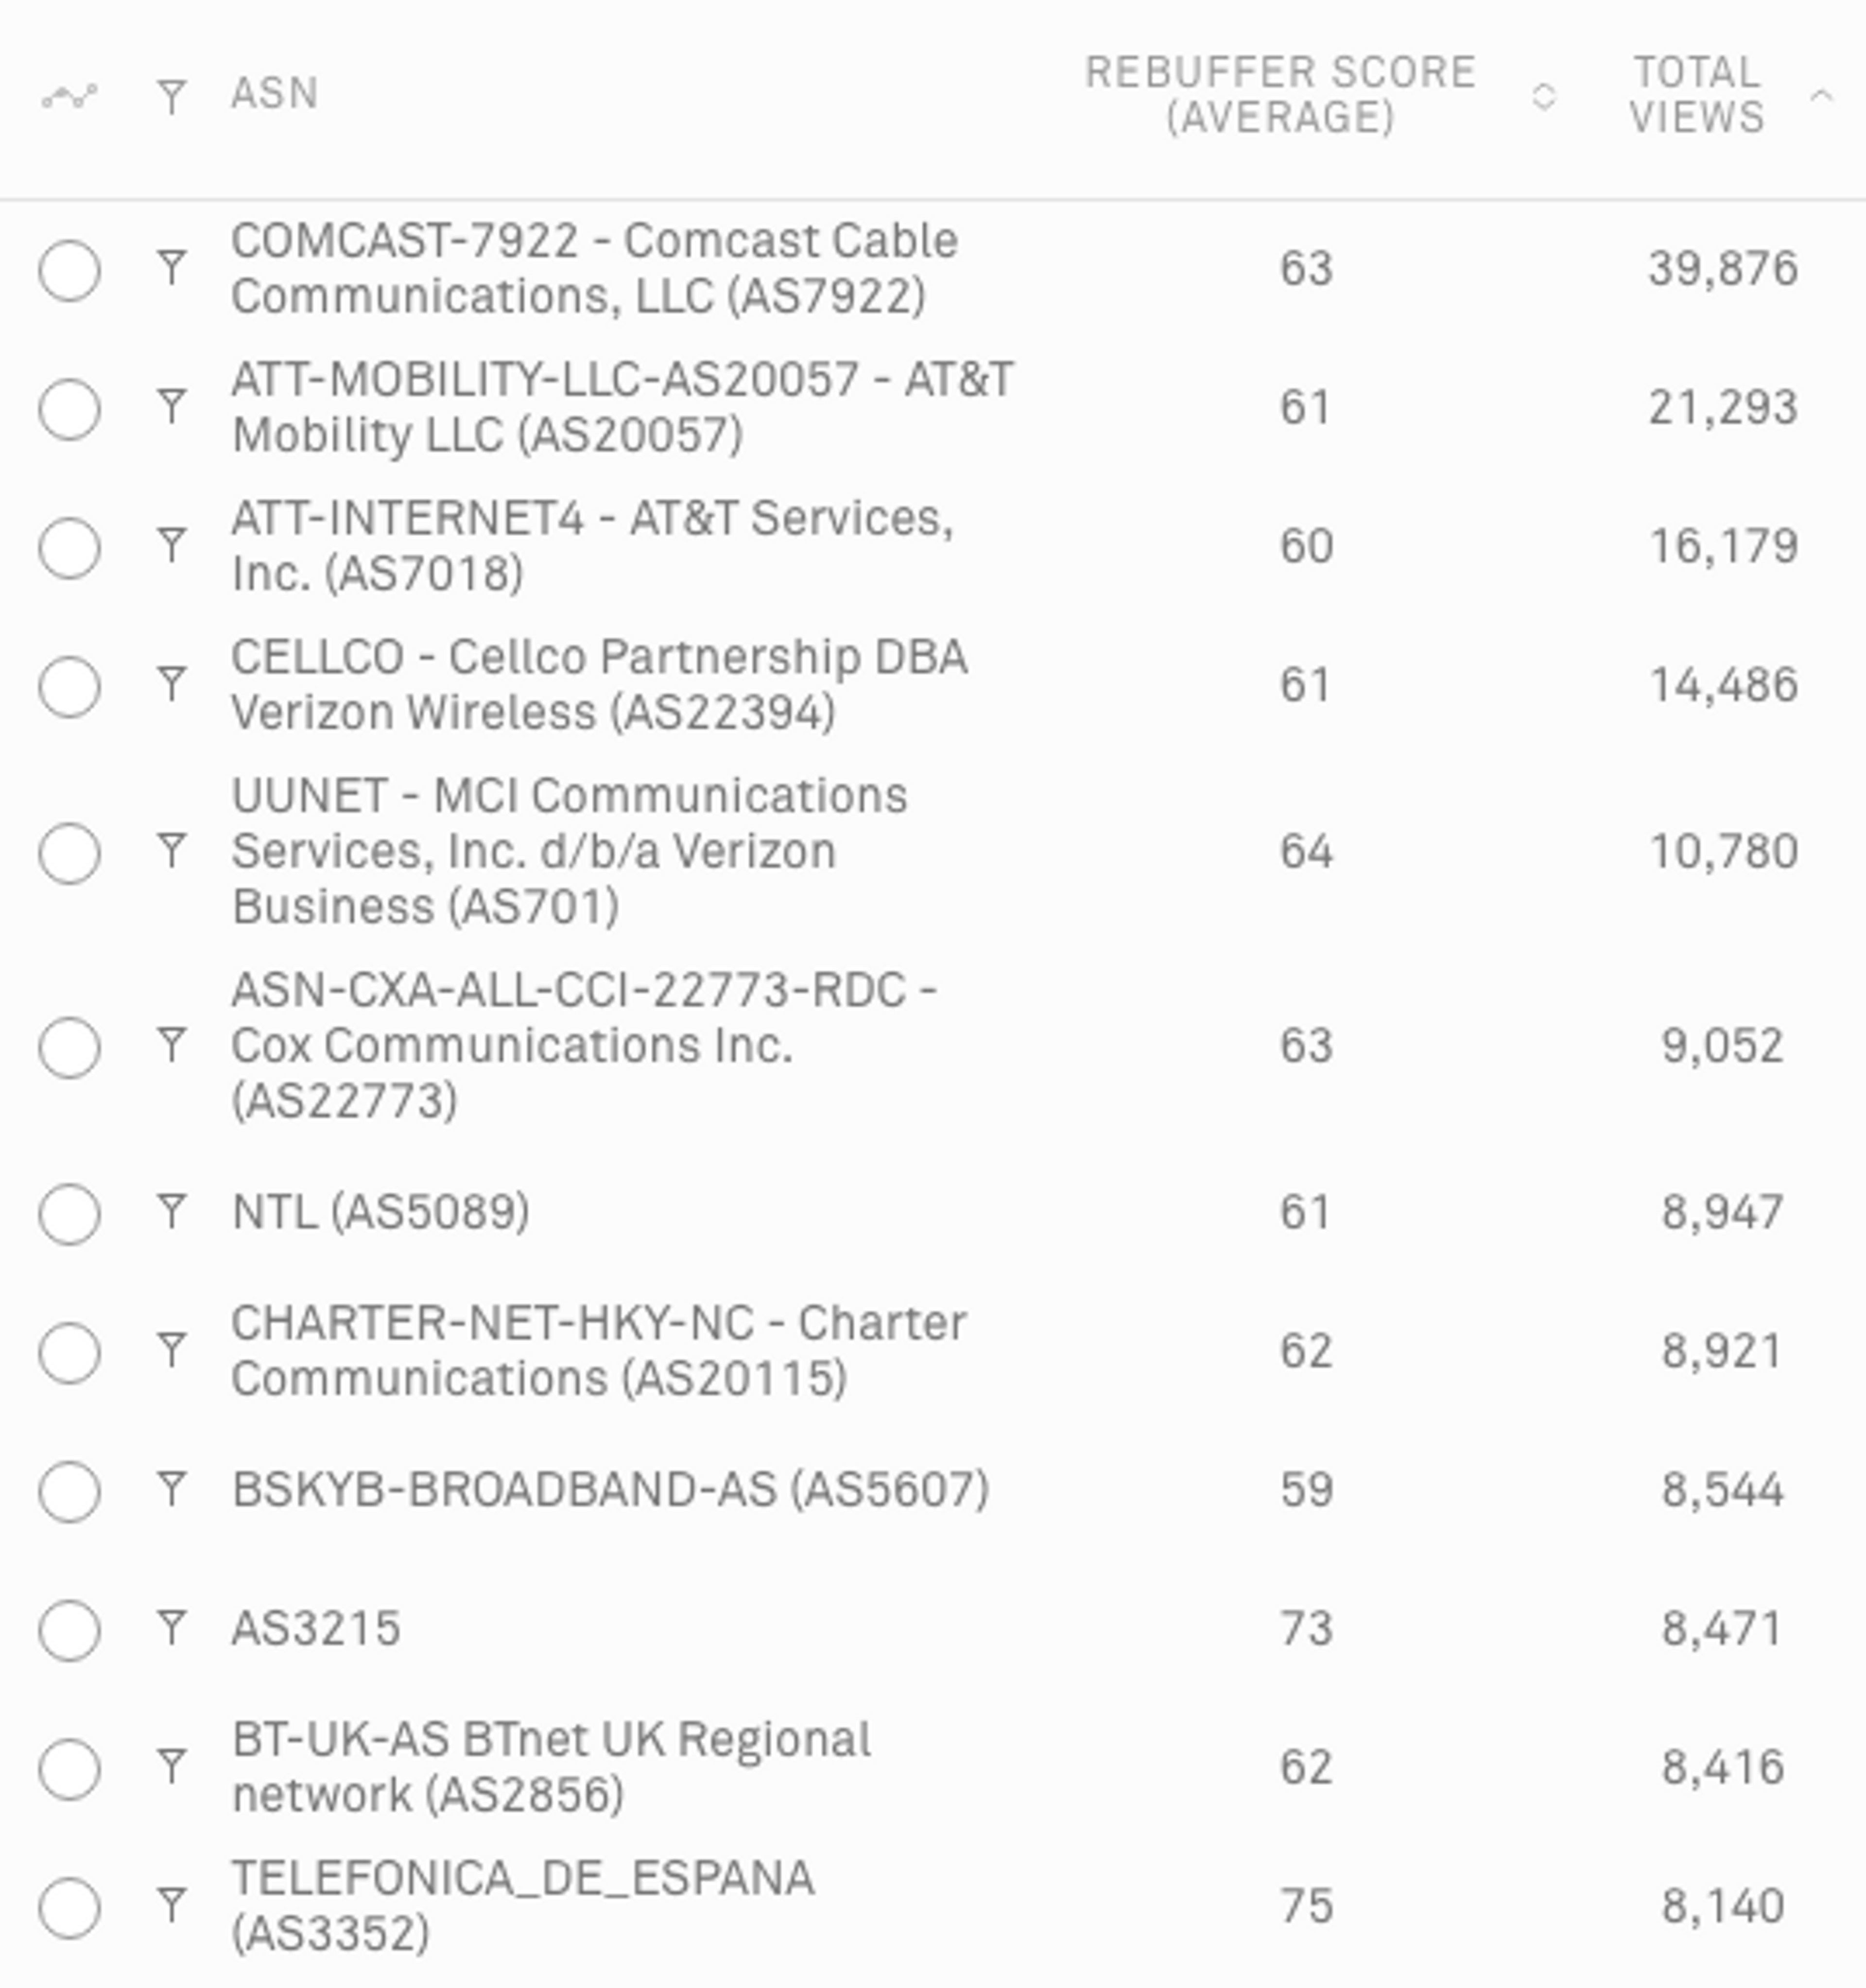
Now let’s move up the ladder. We’re noticing a trend rather than a spike. This is not an anomaly, this is a real problem. To begin picking apart the CDN we can filter our rebuffering metrics by Country.
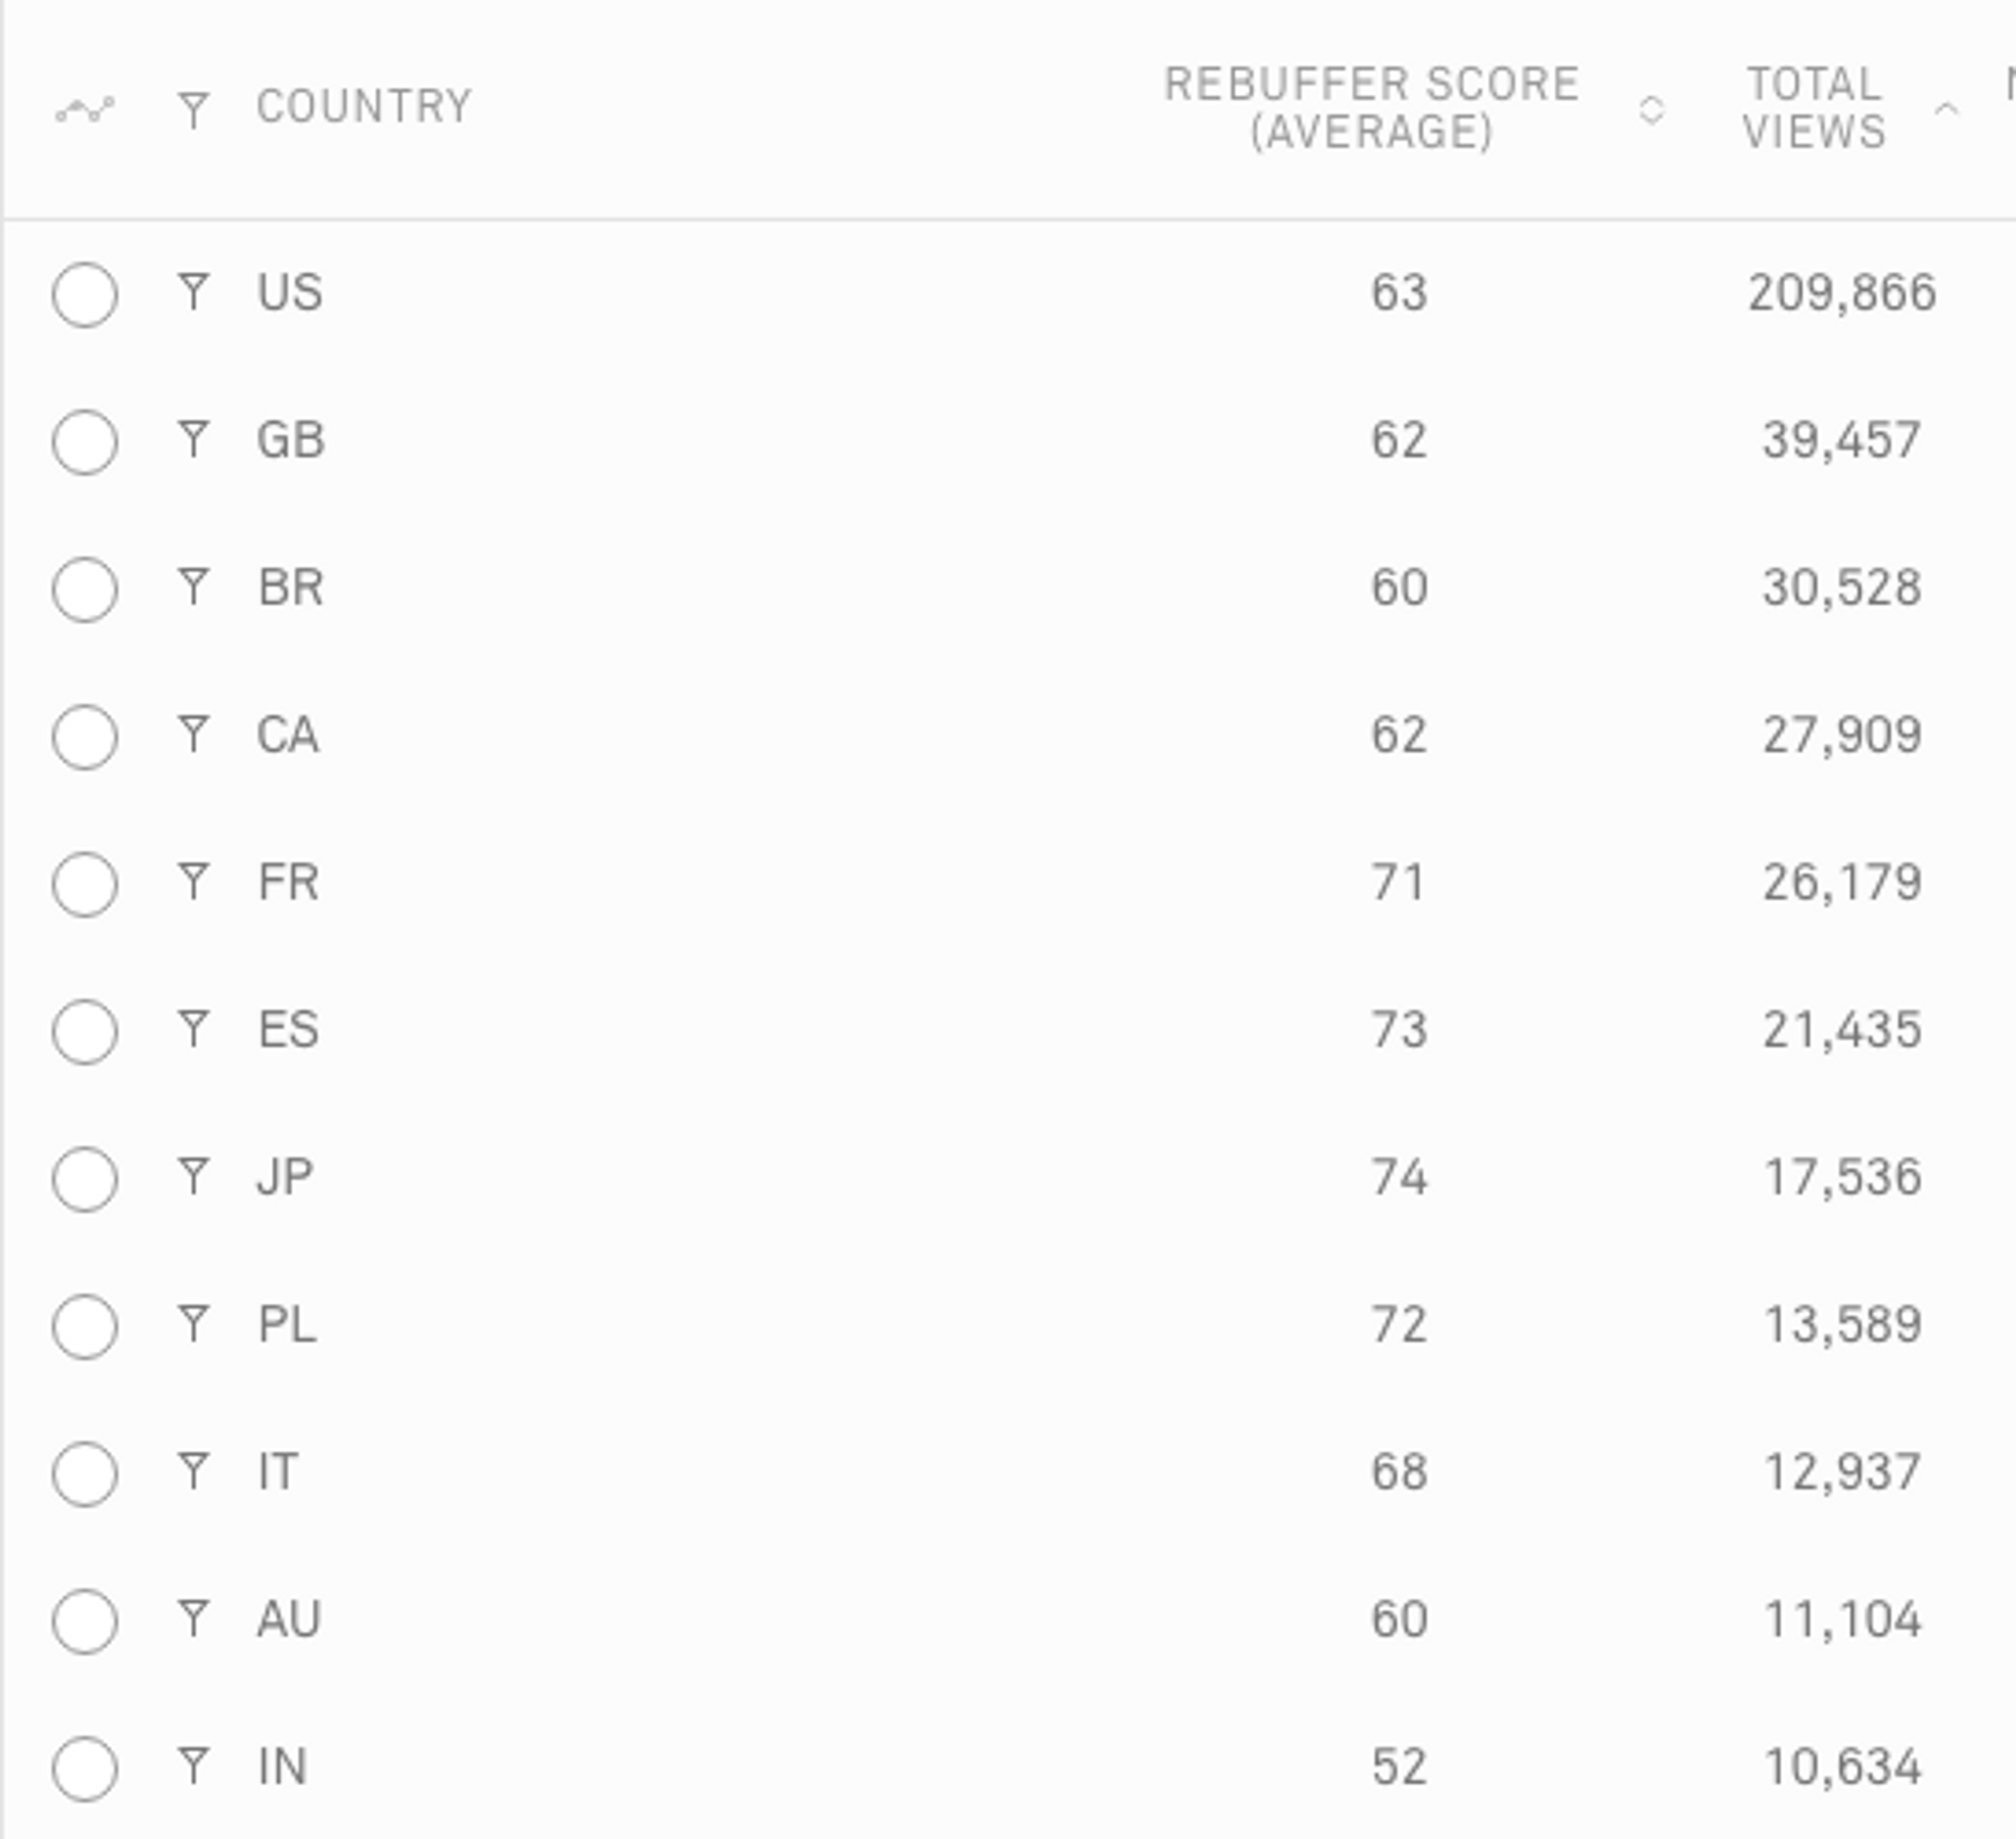
A CDN is used to cache content close to users, but most CDNs don’t do this as well across larger distances. If rebuffering is high in particular countries, this might mean that your CDN provider is struggling in delivering video from your source, to that country. From here, we can decide to compare between different CDN providers and see if we can improve our video delivery.
Moving up the ladder another rung, we’ve come to issues the publisher can control more directly. If it’s not the ISP or the CDN, then the problem may be the encoding process or the player itself.
With encoding, ideally our manifest is going to dictate the correct bitrate for video encoding. However, because H.264 and other codecs encode at a Variable Bitrate (VBR) - where the video is encoded with a low bitrate at still moments, and high bitrate durings fast action - the average bitrate described in the manifest may not accommodate enough bandwidth for the video to play smoothly.
This means when the action suddenly heats up, we’re likely to see buffering. Uh oh.

Going up one last rung we can investigate the player. Commonly there is a fault in the Adaptive Streaming strategy, where the player can be over-aggressive in its choice of quality. Maybe the bandwidth is just above the average bitrate of the video, so the player chooses the highest quality, which is perhaps not optimal given its VBR and sudden bursts of action.
This then becomes a trade-off between quality and buffering, between player and encoding. The player could be more cautious and choose a lower bitrate and play without buffering, but then some quality has been lost that the viewer may have been able to experience.
It all starts with data
Rebuffering really hurts publishers. Studies have shown that up to 40% of viewers abandon a video after just one rebuffering event. Every publisher who cares about their users, needs to work hard to eliminate rebuffering, and the best way to do that is with data.
If you don’t have access to the data you need to make your platform better, feel free to reach out to us for a demo.
For the previous articles in this series, check out our articles on Video Startup Time, and Video Quality.


