Skip to content

The Mux Blog

We're a team of engineers, marketers, designers, all passionate about video and the work we create together. Welcome to our blog about video.

Search
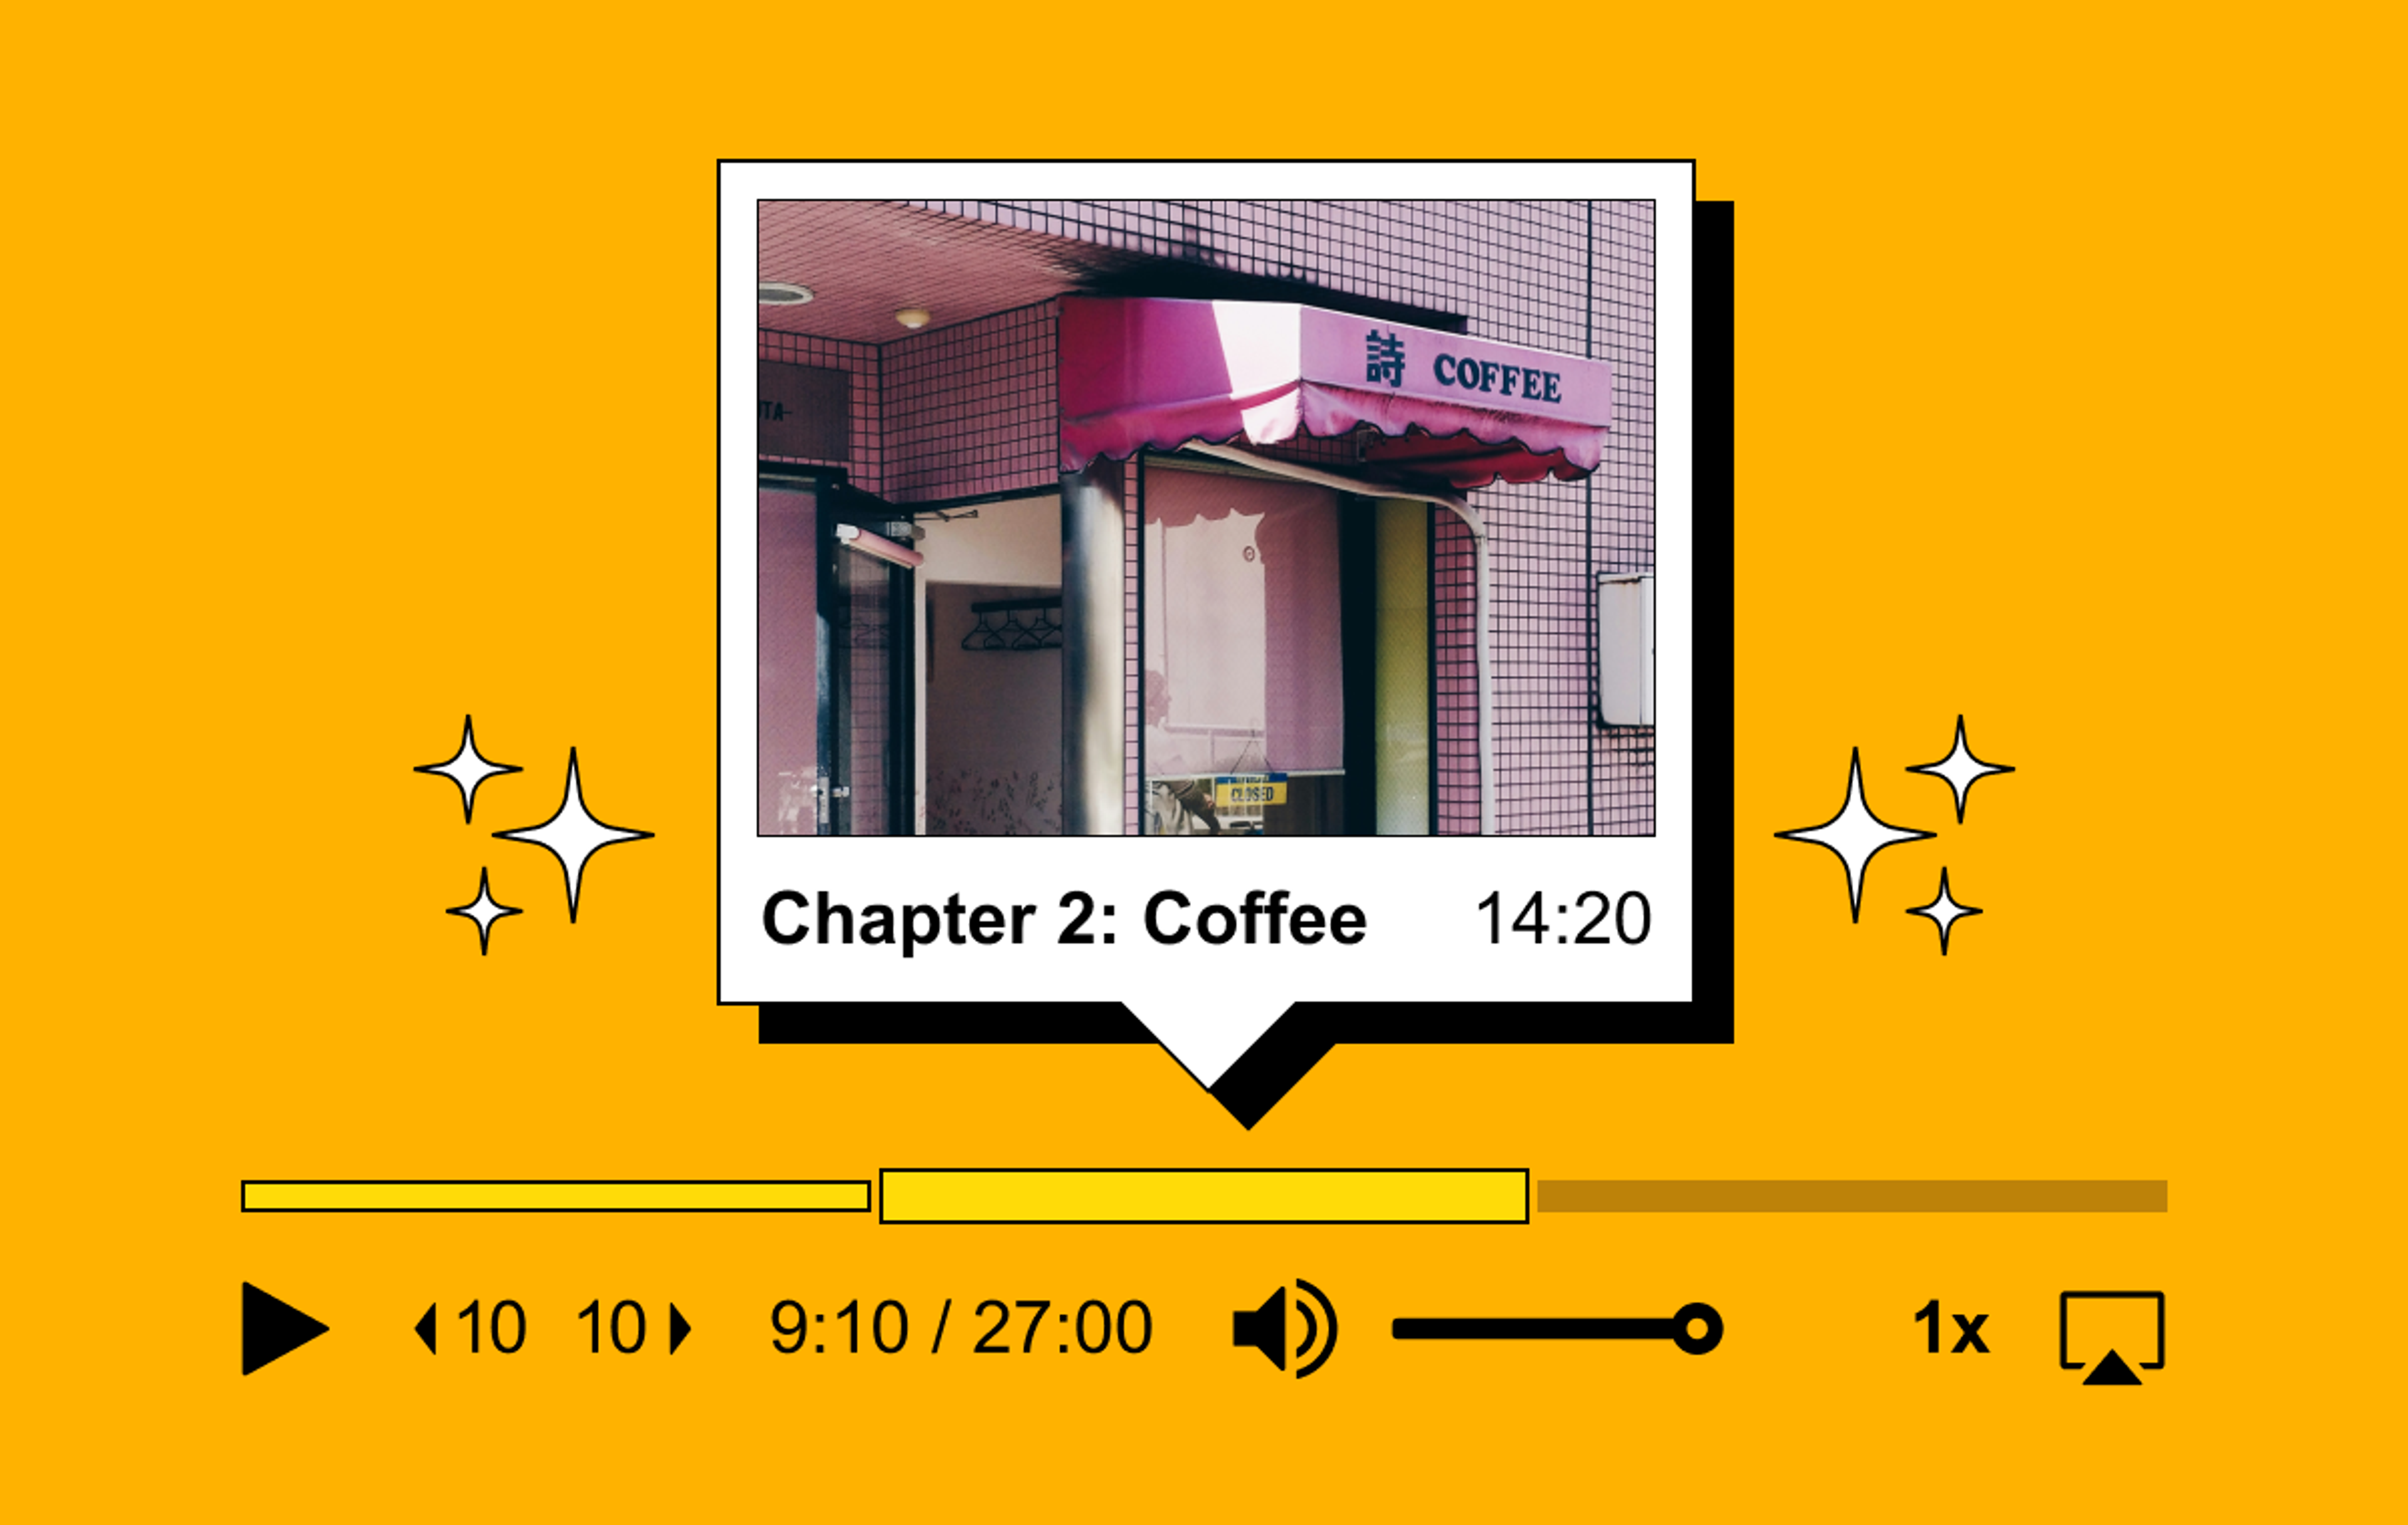
An illustration of an area map appearing in a video player window

Published on November 10, 2023 (about 1 year ago)

Dave Kiss
By Dave Kiss6 min readEngineering

In this article, we’ll go over one way you can set up viewer playback tracking and generate a video heatmap to display in a React app.

The image serves as a symbolic representation of the challenges and processes associated with load testing in the realm of web applications.  At the core of the depiction is a classic smiley face, which can be seen as the web application itself. It stands resilient and contented, an emblem of a well-optimized system that aims to please its users. The simple and cheerful expression on the face underscores the desired outcome of any web application: smooth performance and user satisfaction.  From the left, countless disjointed lines approach the ear, each representing different types and intensities of web traffic. These lines may illustrate varied user requests, diverse data inputs, or multiple sessions, echoing the unpredictable nature of user behavior and real-world web traffic. The chaotic convergence into the ear symbolizes the often overwhelming demands placed on a web application during peak times or during an aggressive load test.  Remarkably, from the right ear emanates a pristine sine wave. In contrast to the chaotic influx, this sine wave epitomizes the ideal output: smooth, consistent, and undisturbed performance. It embodies the aspiration of load testing – to transform unpredictable, high-volume requests into consistent and harmonious system performance.  Overall, the imagery compellingly conveys the essence of load testing for web applications: ensuring that amidst the cacophony of diverse user demands, the system delivers a uniform, reliable, and satisfactory user experience.

Published on September 15, 2023 (about 1 year ago)

Stephen Crowe
Electra Chong
By Stephen and Electra14 min readEngineering

How seven Mux Data engineers conquered unprecedented challenges by supporting an event with a record-setting CCV.

A graphic design showing a large crowd on a laptop screen with a green chart overlaid on top.

Published on August 29, 2023 (about 1 year ago)

Sarah Brown
By Sarah Brown6 min readCompany & Engineering

This past spring, we stepped up to the challenge of using Mux Data to monitor one of the largest live streaming events in history. Here's how we did it.

A graphic design of a group of thunderstorm clouds containing icons that depict the actions of a typical cloud encoding service.

Published on August 24, 2023 (about 1 year ago)

Steve Heffernan
By Steve Heffernan8 min readEngineering

It's becoming increasingly clear that cloud encoding APIs are on their way out. Read our perspective on where cloud video encoding is headed.

An illustration showing a service worker sitting between a browser and a cloud icon

Published on August 21, 2023 (about 1 year ago)

Matthew McClure
By Matthew McClure12 min readEngineering

Service workers have so much potential. Let's explore building a media proxy as a service worker that can run in your browser or in the cloud.

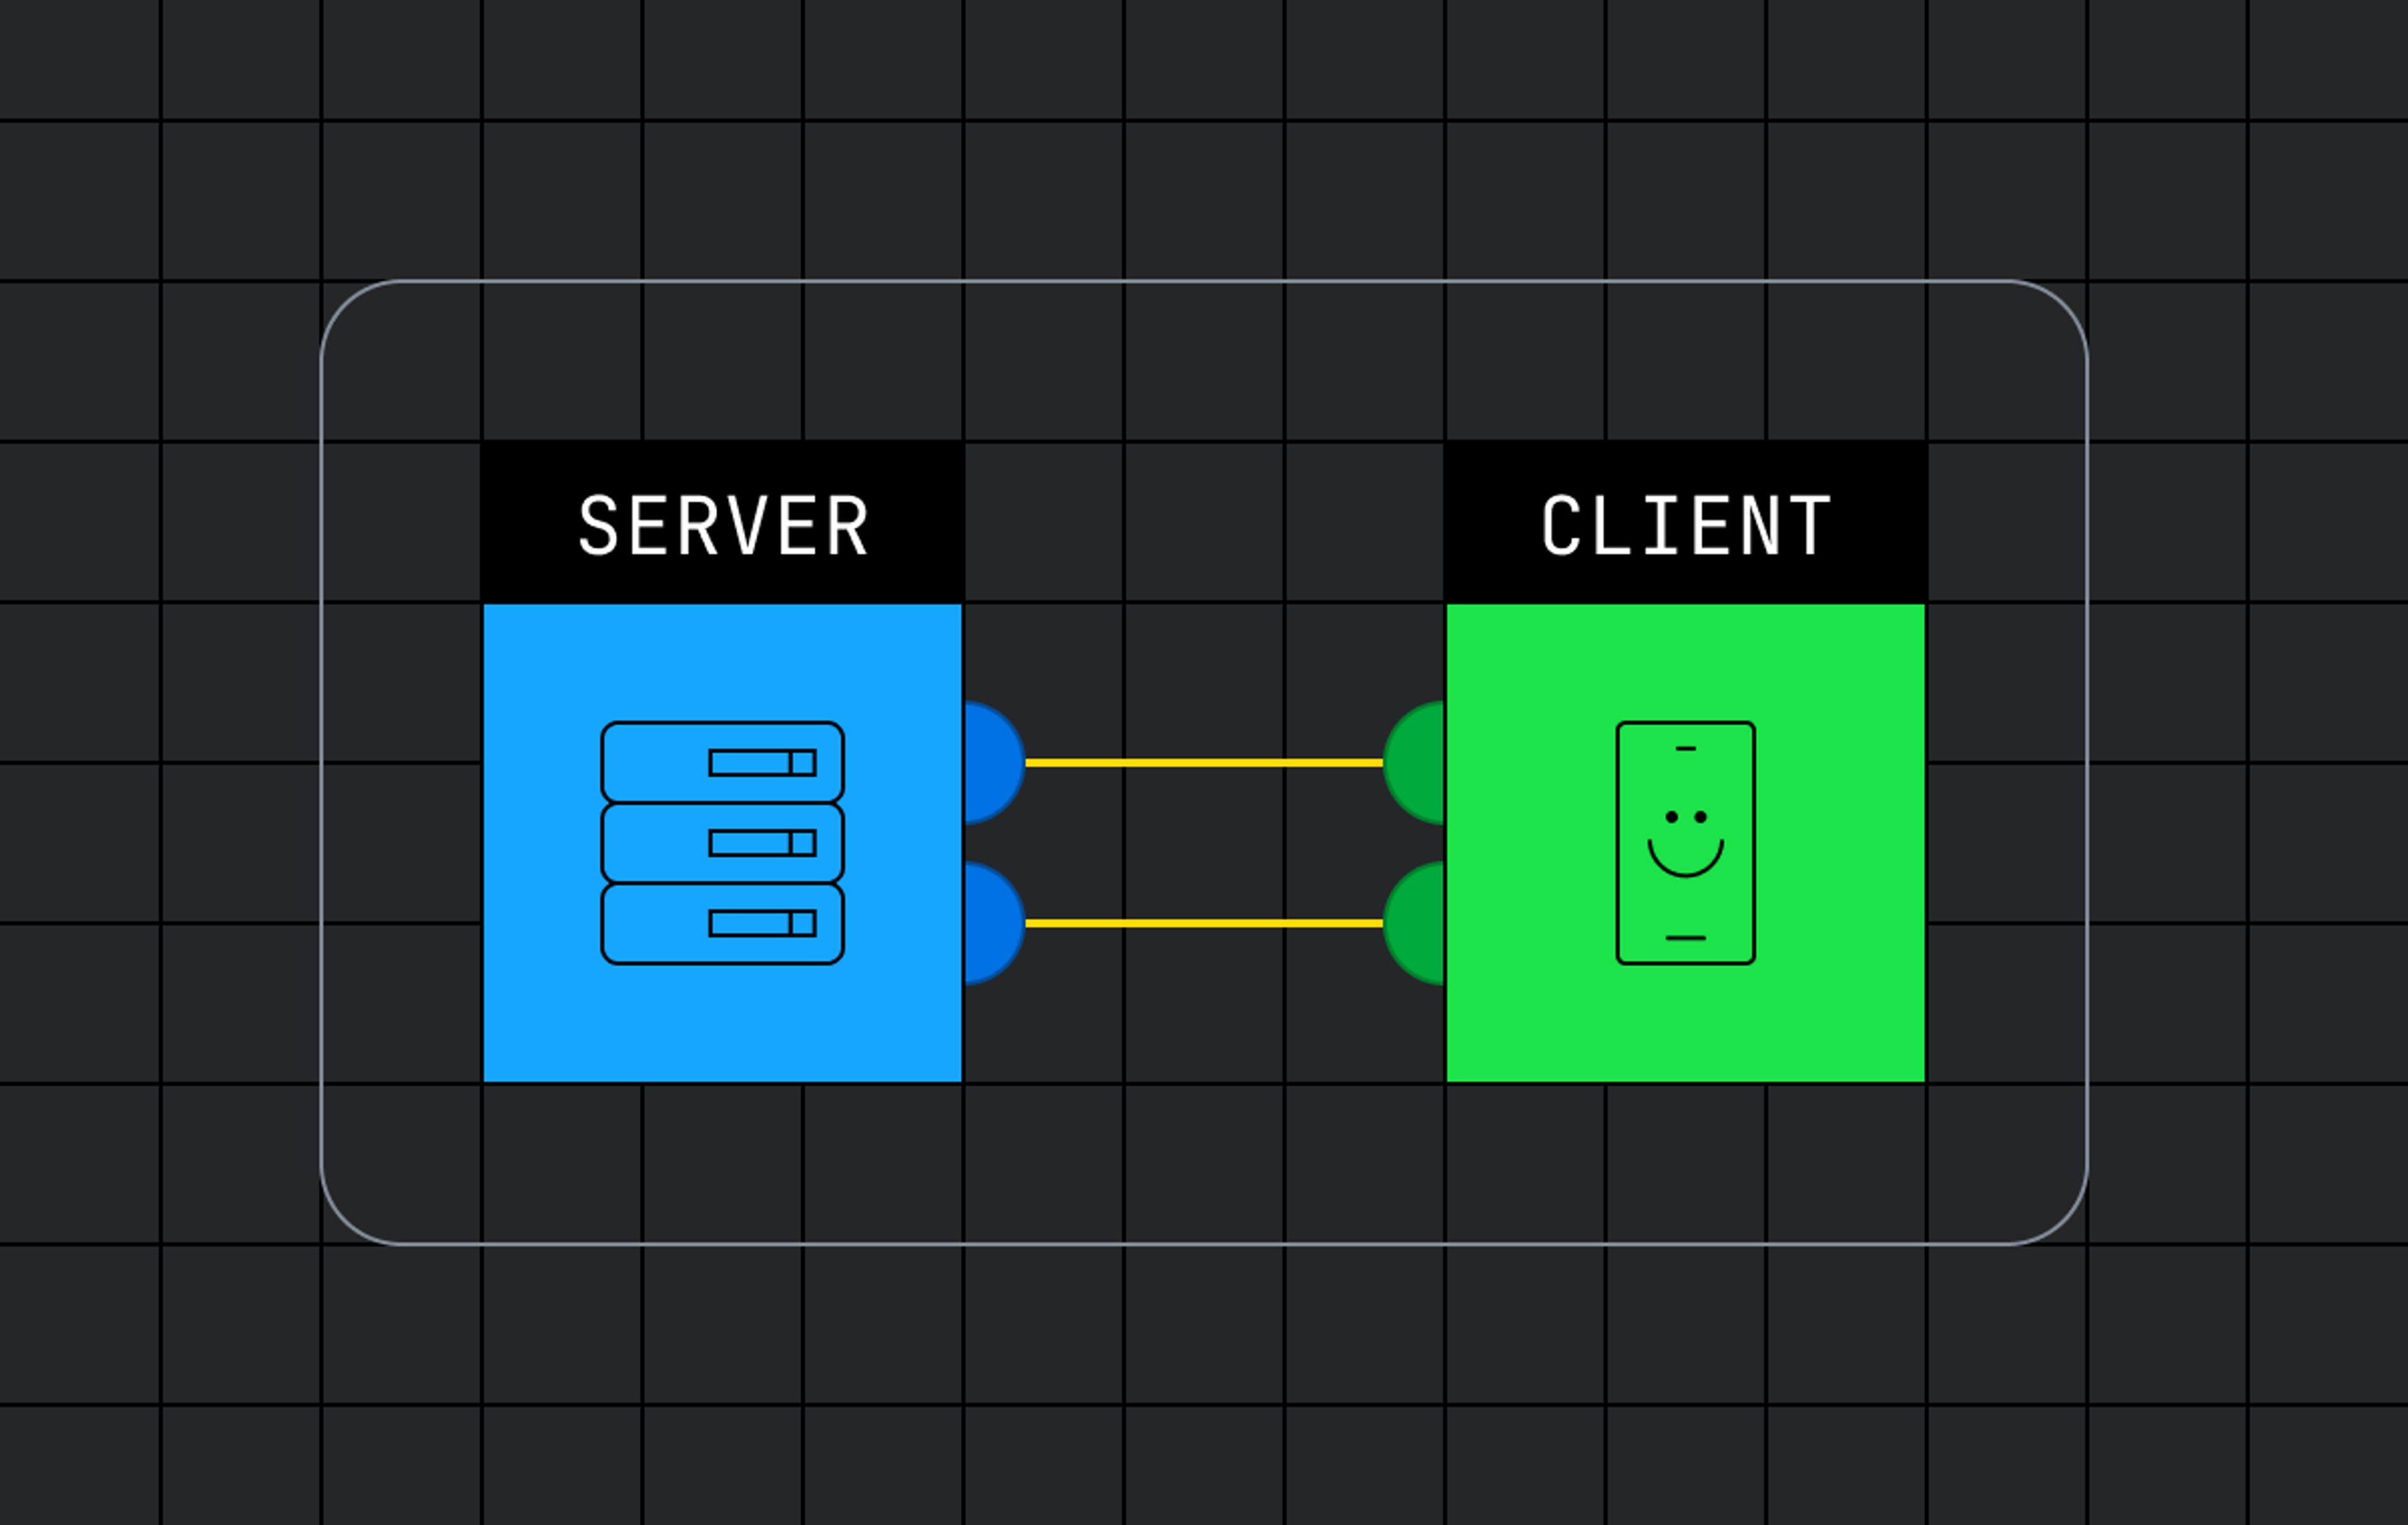
A diagram depicting a client device interacting with a server via a communication line. A lightning bolt sits in between both the client and server.

Published on August 10, 2023 (over 1 year ago)

Darius Cepulis
By Darius Cepulis9 min readEngineering

React Server Actions offer a way of simplifying posting data to the server by calling a simple function instead. But do they live up to the promise?

An illustration of a browser window showing different page components highlighted in different colors, depicting that some components are client-rendered while others are server-rendered.

Published on July 19, 2023 (over 1 year ago)

Darius Cepulis
By Darius Cepulis20 min readEngineering

Server Components run on the server instead of the client, giving you control over your bundle size and data fetching. Here’s everything we learned about them.

A graphic design that show a video player control bar. Hovering over the timeline are markers containing lightning bolts, depicting events occurring at specific points during the media playback.

Published on July 12, 2023 (over 1 year ago)

Christian Pillsbury
By Christian Pillsbury10 min readEngineering

Learn how you can associate interactive transcript metadata with your video playback to fire custom events as your video progresses.

A design showing a green bar chart that continues to grow up and to the right

Published on July 6, 2023 (over 1 year ago)

Scott Kidder
By Scott Kidder13 min readEngineering

Learn how Mux migrated from a shared, distributed Riak key-value (KV) store to the BadgerDB embedded KV store and the massive benefits it brought us.

An illustration of a beetle displaying on a smart TV. A purple cord is plugged in to the TV and winds its way around the beetle.

Published on June 30, 2023 (over 1 year ago)

Edwin Mejia
Grady Player
Alex Paseltiner
By Edwin, Grady, and Alex13 min readEngineering

Read a debugging journey that had us buying discontinued hardware off eBay and exhausting every possible industry contact that might have any insight.