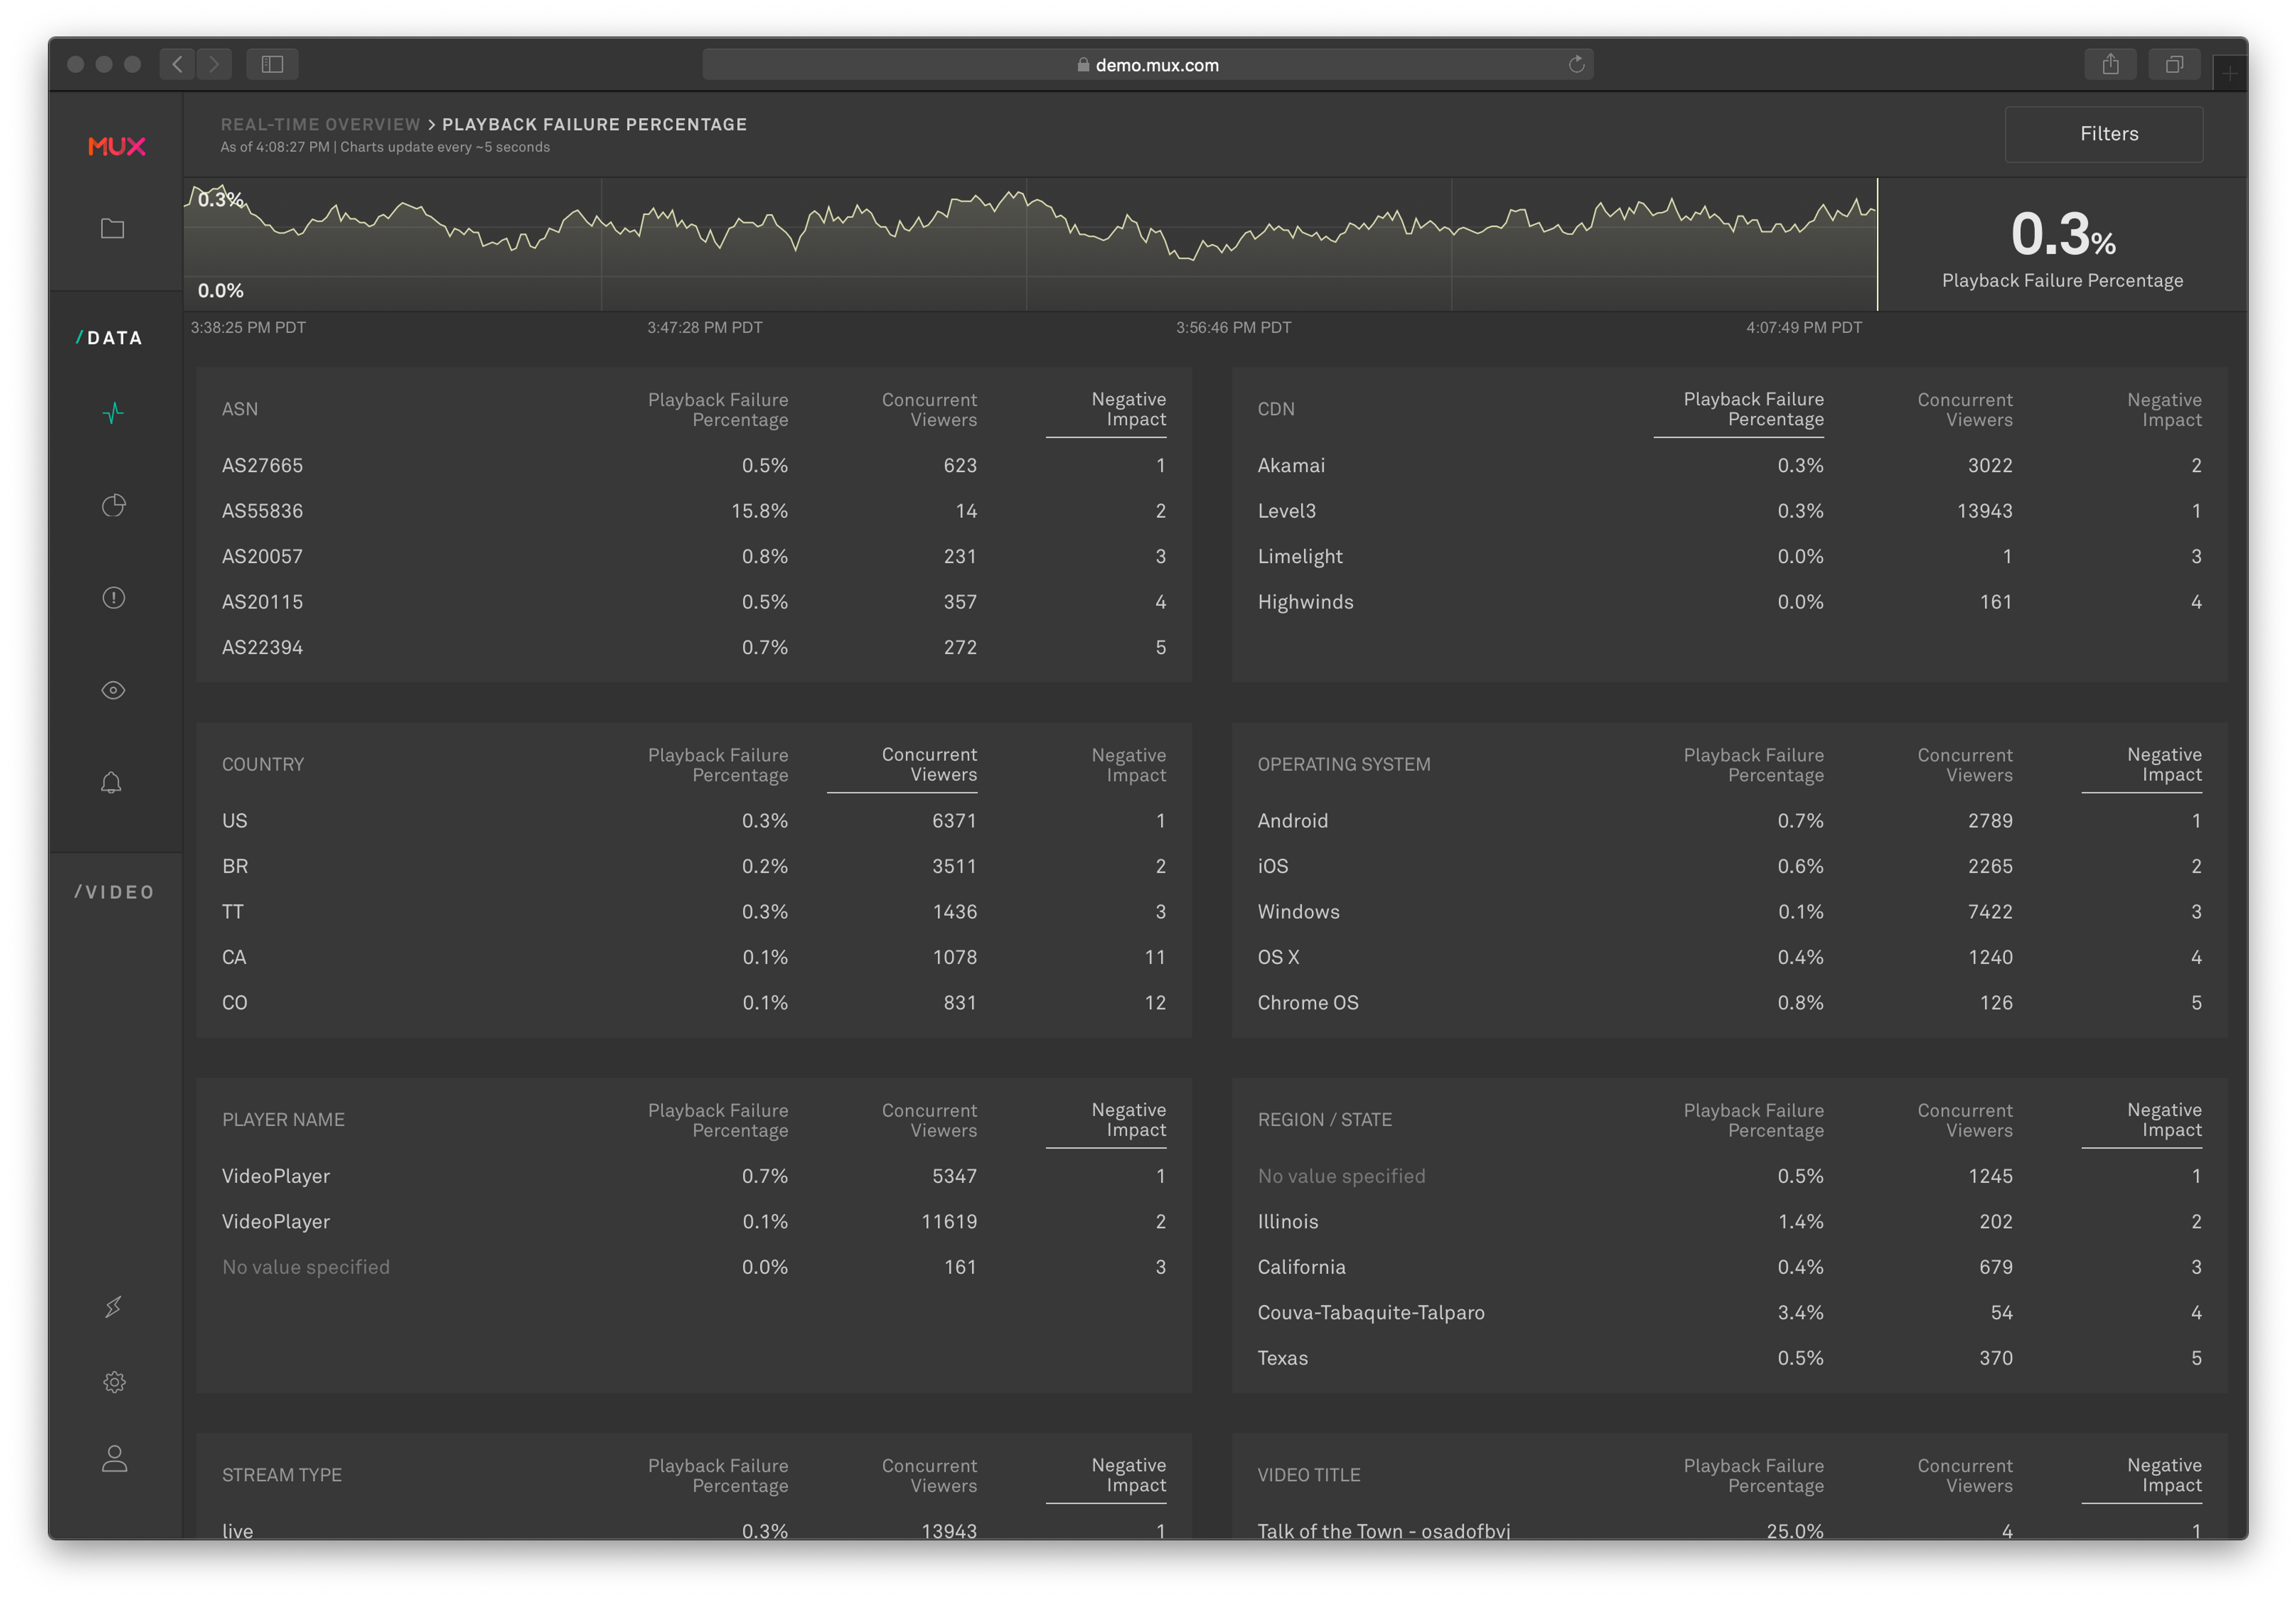
Our core focus is to help you provide your viewers with an exceptional video experience. In our last feature update for the Real-Time Dashboard, we introduced filters which helps you monitor the performance of your video streams based on specific dimensions you select. Now, we’re introducing a new metrics page that provides a deeper level of data to help you resolve streaming issues even faster. This is especially helpful if you don’t know which dimension to investigate first and need a place to start.
The new metrics page includes a breakdown for the following metrics:
- Playback failures by concurrent viewers (CCV)
- Exits before video start by concurrent viewers
- Current rebuffering percentage
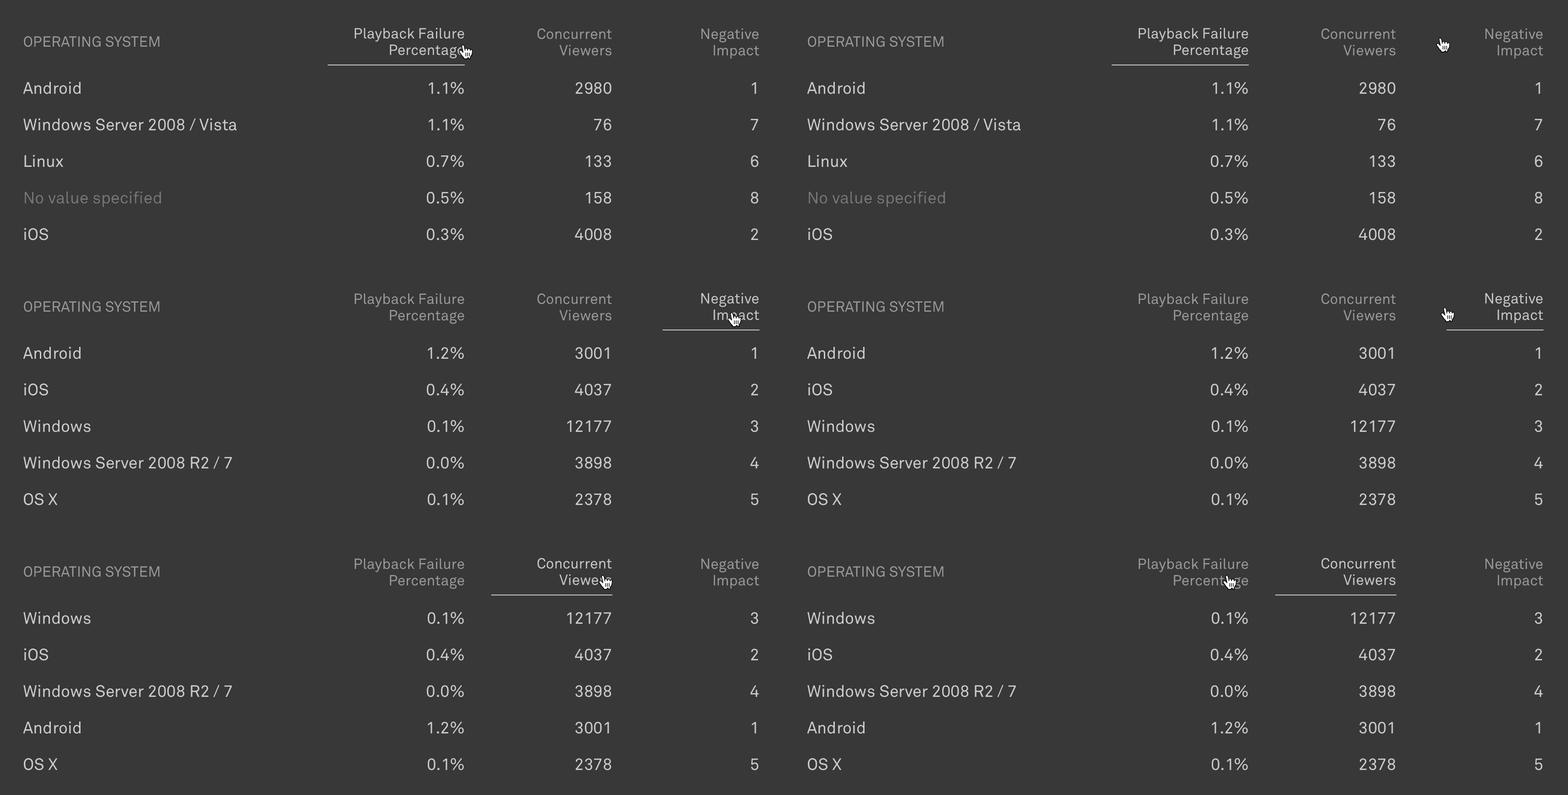
Each detailed page will show you the top 5 values for each dimension sortable by performance metric, CCV, or negative impact. With all of this data in one view, you can now easily compare the values within and across all of the dimensions and start to understand where a specific problem is happening the most frequently.

For example, if you see on the Real-Time Dashboard Overview that playback failures has spiked, you can click through to that metric’s page. There, you can sort each of the seven dimensions by:
- The metric’s value (in this example, Playback Failures Percentage)
- Concurrent viewers
- Negative impact
This lets you identify the dimension(s) that has the highest value and quickly narrow down where to do a deeper dive to find the root cause.

In addition, you can apply filters to this page to help answer questions that includes multiple dimensions. For example, if you wanted to quickly compare how all the operating systems in Great Britain are performing in terms of playback failure, all you would have to do is filter the playback failure breakdown page by the country dimension and select Great Britain.
How to get access
The new metrics page is available for Mux Media customers. If you’re interested in seeing a demo of the new breakdown metrics, contact us and we’d be happy to set it up.


